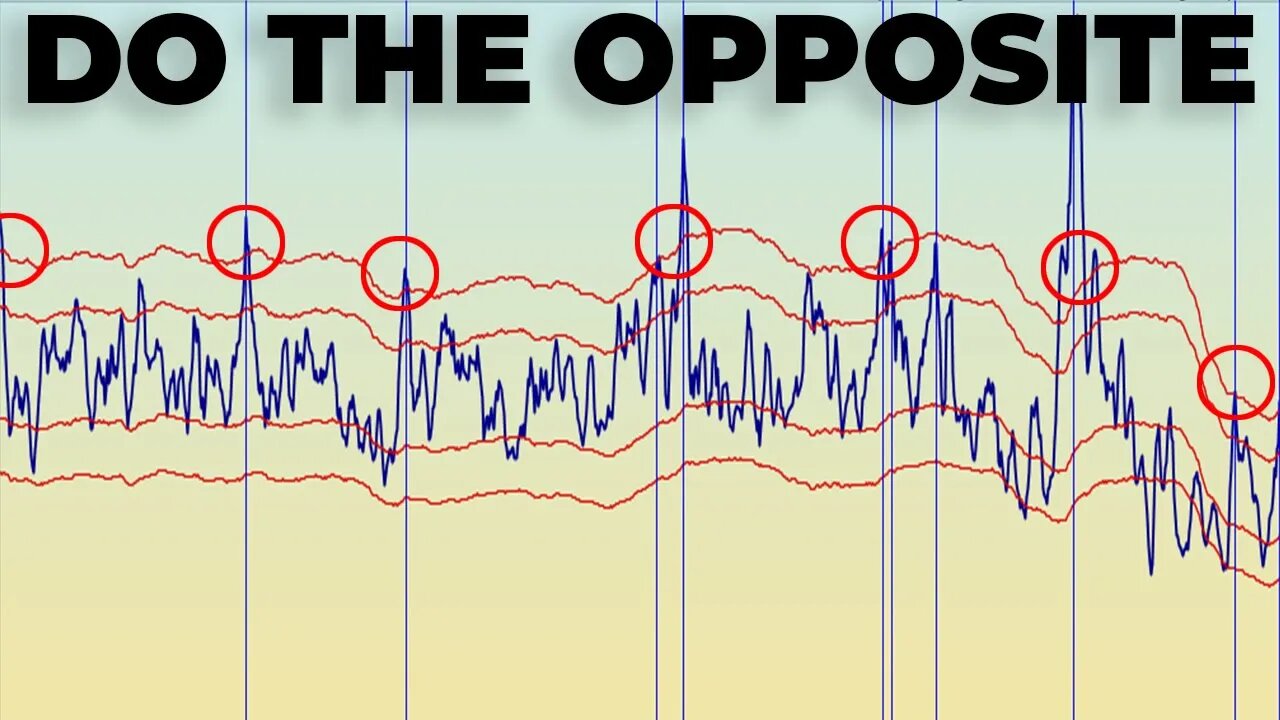
Short Term Breadth & Sentiment Indicators Suggest Bullish Move For The Stock Market Into Election
These Stock Market Breadth & Sentiment indicators suggest a short term move to the upside into the presidential election. Will doing the opposite of what the retail traders are doing work out this time around? History suggest that that equity traders are typically wrong when these stock market indicators hit extreme levels.
In the stock market daily brief I use technical analysis to help better understand where the stock market might be heading next. I analyze SP500, Nasdaq 100, Dow Jones, Russell 2000, various stock market indicators, commodities, yields and the US Dollar.
STOCK MARKET BIG PICTURE:
https://youtu.be/VAxxvFv-VzI
STOCK TRADING PLATFORM I USE
○ Webull (GET 2 FREE STOCKS): https://bit.ly/3i5U591
MY FAVORITES - https://amz.run/3JLv
○ Book Recommendations
○ My Studio Setup
○ Morning Coffee
COME SAY HI:
Instagram: https://www.instagram.com/figuringoutmoney
Twitter: https://twitter.com/mikepsilva
Make sure to SUBSCRIBE to my channel!
DISCLAIMER: I am not a professional investment advisor, nor do I claim to be. All my videos are for entertainment and educational purposes only. This is not trading advice. I am wrong all the time. Everything you watch on my channel is my opinion. Links included in this description might be affiliate links. If you purchase a product or service with the links that I provide I may receive a small commission. There is no additional charge to you! Thank you for supporting my channel :)
-
 23:55
23:55
Figuring Out Money
1 year agoWeird Things Are Happening Right Now
60 -
 16:19
16:19
Figuring Out Money
3 years ago $0.09 earnedI'm NOT Bullish Until THIS... | Stock Market Analysis
215 -
 13:35
13:35
Figuring Out Money
3 years agoUntrustworthy Stock Market Bounce Despite Bullish Signals | Proceed With Caution
19 -
 15:25
15:25
Figuring Out Money
4 years agoStock Market Sentiment Gets VERY Bearish
13 -
 5:31
5:31
Rob Almasi
3 years agoStock Market Today
562 -
 0:35
0:35
Master Lama Rasaji
3 years agoConfidence In Stock Market?
42 -
 44:51
44:51
American Thought Leaders
14 hours agoHow This Tech Can Break China’s Rare Earth Monopoly | Dr. James Tour
2.17K2 -
 1:16
1:16
From Zero → Viral with AI
20 hours agoAI Isn’t Killing Work. It’s Killing the Wrong Kind of Work.
102 -
 2:47:27
Squaring The Circle, A Randall Carlson Podcast
19 hours agoEPIC! Randall & Sabin Howard, Master Sculptor Known As "Michelangelo of America," talk WAR or PEACE!
1.33K -
 22:42
22:42
Benjamin Sahlstrom
1 day ago $9.37 earnedHow To Refill 1lb Portable Propane Tanks!
64.2K11