Stock Market Breaks Out & Rips To All Time Highs (SP500 4000 Next?)
In today's daily stock market brief I cover the stock market breaking out & ripping to all time highs. I will look at stock market sectors relative strength performance and map out important levels and stock market indicators to keep an eye on.
TIMESTAMPS:
Intro: 00:00
Market Dashboard: 01:00
Relative Strength: 03:40
SP500 Technical Analysis: 09:40
Russell 2000 Analysis: 12:22
Dow Jones Analysis: 13:43
Nasdaq 100: 15:02
Stock Market Indicators: 17:46
Commodities: 24:25
Dollar Analysis: 28:15
Conclusion: 30:02
STOCK TRADING PLATFORM I USE
○ Webull (GET 2 FREE STOCKS): https://bit.ly/3i5U591
MY FAVORITES - https://amz.run/3JLv
○ Book Recommendations
○ My Studio Setup
○ Morning Coffee
COME SAY HI:
Instagram: https://www.instagram.com/figuringoutmoney
Twitter: https://twitter.com/mikepsilva
Make sure to SUBSCRIBE to my channel!
DISCLAIMER: I am not a professional investment advisor, nor do I claim to be. All my videos are for entertainment and educational purposes only. This is not trading advice. I am wrong all the time. Everything you watch on my channel is my opinion. Links included in this description might be affiliate links. If you purchase a product or service with the links that I provide I may receive a small commission. There is no additional charge to you! Thank you for supporting my channel :)
-
 9:51
9:51
Figuring Out Money
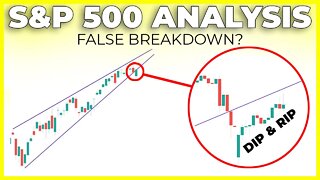
3 years agoThe Stock Market Dipped & Ripped (Was This A False Breakdown?) | SP500 Technical Analysis
6 -
 17:38
17:38
Figuring Out Money
3 years agoSTOCK MARKET IS ABOUT TO BREAK...
-
 12:03
12:03
Matt Kohrs
1 year agoStocks Rip Even Higher 🚀🚀🚀 || AMC, GME, NFLX, SPY & TSLA
133 -
 2:22:17
Day Trade with Tony
2 years agoLIVE DAY TRADING PRE MARKET & THE OPEN! Stock Market Crash | RDBX Squeeze | AERC & DAWN | S&P 500
-
 14:47
14:47
Matt Kohrs
2 months agoURGENT: The Stock Market Is BREAKING DOWN!!
2.28K1 -
 3:02:57
Matt Kohrs
1 year agoStocks & Crypto Rip Higher 🚀🚀🚀
28.2K37 -
 4:44:13
Matt Kohrs
1 year agoStock Market Rips Higher 🚀🚀🚀
53.9K33 -
 1:06:16
Day Trade with Tony
2 years agoLIVE DAY TRADING POWER HOUR & THE CLOSE! Stock Market Crash | RDBX Selloff | AUVI | CMRA | S&P 500
-
 2:06:19
Matt Kohrs
2 years agoStock Market News, Trends & Predictions
8.54K19 -
 35:32
35:32
Matt Kohrs
2 years agoStock Market News, Trends & Predictions
9053