Rigged-Vaccines - the Vaccinated/Unvaccinated Stats
Stunning: Dr. Paul Thomas Blows Up the Conventional Vaccine Narrative—Incredible statistics.
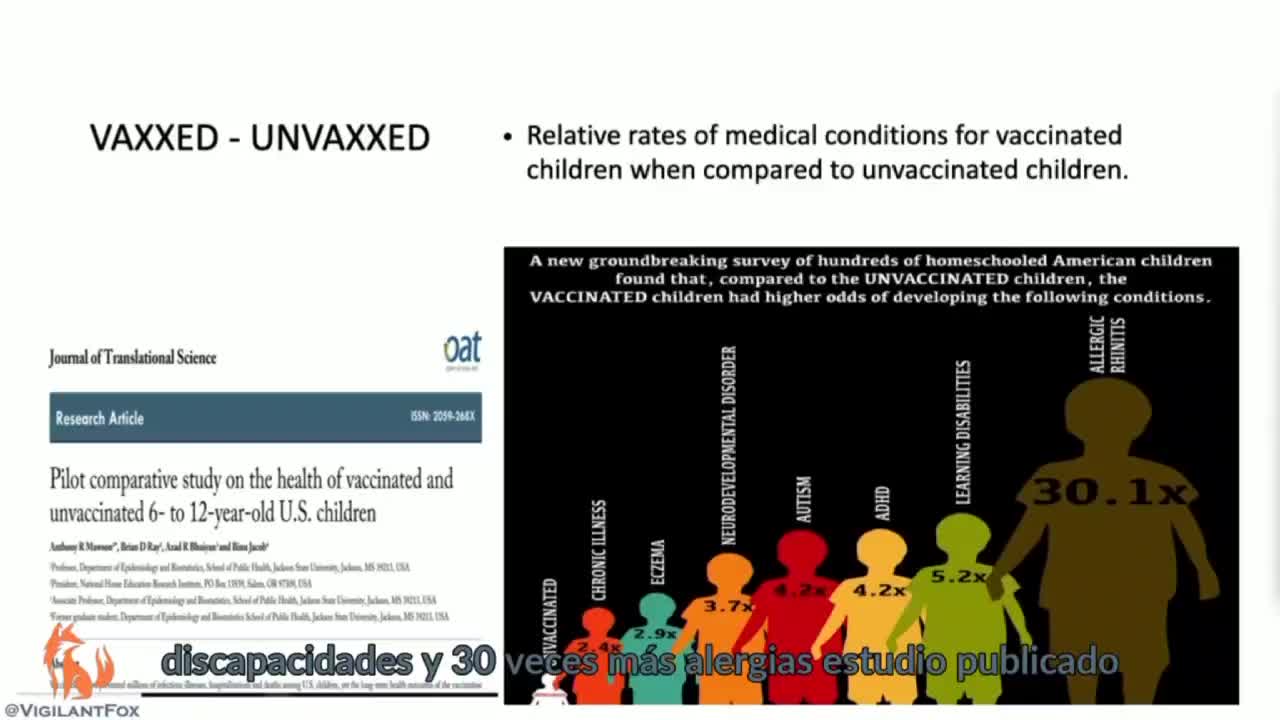
'The Control Group' Stats - Vaccinated / Unvaccinated
60% / 5.71% - Chronic Conditions
16.67% / 0% - Arthritis
48% / 0% - Heart Disease
10% / 0% - Diabetes
7.7% / 0% - Asthma
2.5% / 0% - Autism
9.4% / 0.47% - ADHD
6.0% / 0% - Cancer
Download this clip on Telegram:
https://t.me/c19Videos/134
Full Video:
https://rumble.com/v104s18-dr.-paul-thomas-what-do-vaccines-actually-do-to-people.html
Paper:
Relative Incidence of Office Visits and Cumulative Rates of Billed Diagnoses Along the Axis of Vaccination
https://www.mdpi.com/1660-4601/17/22/8674
Court Case evidence:
https://informedconsentdefense.files.wordpress.com/2020/12/16-6.pdf
(Post coming soon with all the screenshots & references - will update this description when complete - working on it now)
-
 16:54
16:54
Censored Important Videos
2 months agoChatGPT Surveillance
922 -
 LIVE
LIVE
The Bubba Army
23 hours agoCharlie Kirk's Killer On The Run - Bubba the Love Sponge® Show | 9/11/25
4,414 watching -
 16:58
16:58
Actual Justice Warrior
2 days agoBLM's Original HOAXER Killed By Black Crime
74K62 -
 2:04:21
Badlands Media
19 hours agoDevolution Power Hour Ep. 388: Assassination, Inflection Points, and the Battle Ahead
368K133 -
 2:08:03
Inverted World Live
12 hours agoCharlie Kirk Assassinated | Ep. 106
140K72 -
 3:01:07
TimcastIRL
13 hours agoCharlie Kirk Assassinated, Suspect In Custody | Timcast IRL
697K1.2K -
 5:44:49
Redacted News
16 hours agoTurning the Tide: 9/11 Justice in 2025 — Day 1 with Sen. Ron Johnson, Richard Gage and More
219K98 -
 2:48:00
TheSaltyCracker
13 hours agoYou're Being Hunted ReeEEStream 9-10-25
342K721 -
 13:09:56
LFA TV
1 day agoBREAKING: CHARLIE KIRK ASSASSINATED - WEDNESDAY 9/10/25
415K143 -
 1:31:08
I_Came_With_Fire_Podcast
13 hours agoCheck Fire: God Bless Charlie Kirk
121K36