Bitcoin - Caution. Here's what the bulls are now up against.
Good Morning Traders,
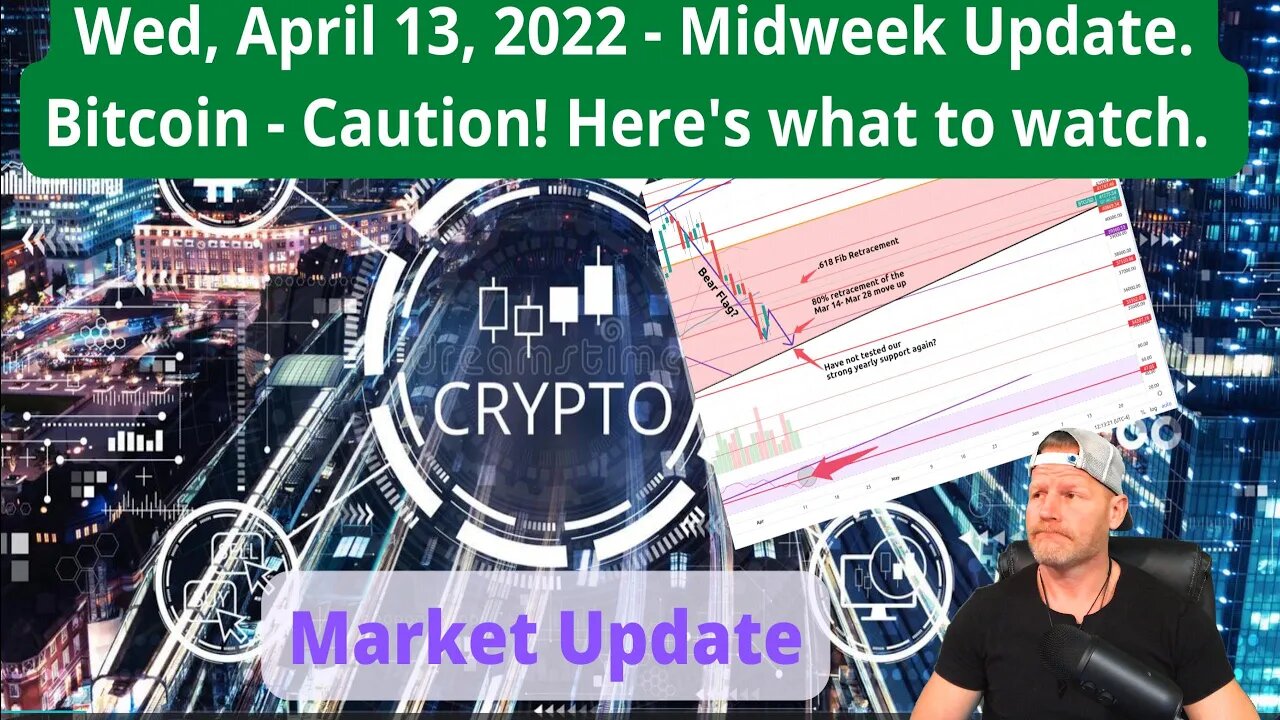
I promised a mid-week update if Bitcoin didn't follow price action as I anticipated. It certainly did not. In fact, we are drawing close to a territory that concerns me. More on that below. But first, let's review what didn't happen:
[*] BTC did not remain above the 100 day
[*] BTC did not remain above the .618 fib retracement level
[*] BTC did not ascend to an anticipated price zone I had circled above in the last chart.
Ok. So now, we must reanalyze our charts based on the new price action and chart data we are observing. I've made note of the key items that I believe are the most significant on the chart. Some of these are bullish variables, and some are bearish.
Let's start with the bearish:
[*] The list above plus,
[*] We are deep in the FUD Zone, which if you zoom out on the daily could, in fact, be a longer-term bear flag from my H&S pattern which has yet to be completely invalidated. Yikes! Let's hope this is not the case.
[*] We are getting too close for comfort to my long-trending yearly support line in the sand which today sits right around 38,500
[*] We are below a fairly strong support level at 40,700 which will now act as overhead resistance
[*] There is the potential that these last two green candles formed on the daily are simply the formation of a new bear flag, in which case, it might move us down further to a re-test of our yearly support.
As you all know, I absolutely DO NOT want us to test that support again. We have now tested this support nearly a dozen and a half times since Jan. and with each test/re-test, that support will become weeker and weeker. I do not know that it will hold should we get another re-test on it! If we break it, down we'll go!
Now the bullish indicators:
[*] We bounced at the 80% fib retracement level. This level was drawn from the move up starting on March 14th to it's end at the 200 day ma on March 28th.
[*] Not testing our yearly support again can also be viewed as positive (though, being so close is not necessarily bullish).
[*] A look at the U.S. dollar chart indicates we are overdue for a pullback on dollar strength. This pullback, should it come, would give BTC the break it needs to move higher.
https://www.tradingview.com/x/VhoobAog/
These are the details that I mainly wanted to relay to you all for now. I will do a video in a bit, reviewing this data and providing clarity for those of you that appreciate it.
Hope this helps a bit. Best to you all. Be cautious and careful with your trades for now. The direction is uncertain.
- Stew
⛓️ 🔗 Useful Links 🔗 ⛓️
(NEW) My Trade Tracker:
https://docs.google.com/spreadsheets/d/1viRw7nLCIHk2iByzrG7Wk2cSXmKsno2ZZK1ZuEJaP-A/edit?usp=sharing
My Subscription Site:
https://stewdam.us
All My Socials:
https://www.stewdam.us/p/social-media
-
 LIVE
LIVE
Nerdrotic
17 hours ago $1.47 earnedNerdrotic Nooner 495
716 watching -
 1:05:03
Russell Brand
2 hours agoWW3 WARNING! Trump Opens Door To US Involvement + Minnesota assassin ARRESTED - SF597
94.1K50 -
 16:23
16:23
China Uncensored
4 hours agoChina’s EV War: Total Destruction
5.18K1 -
 23:11
23:11
The Rad Factory
2 hours agoBuilding The Ultimate Drift Car (With Walmart Parts)
3.66K1 -
 1:03:26
Timcast
2 hours agoU.S. Preparing For DIRECT WAR With IRAN, Air Tankers & Strike Group Deployed
125K412 -
 24:04
24:04
The White House
2 hours agoPresident Trump Attends the G7 Official Welcome
23.3K18 -

Simply Bitcoin
3 hours ago $1.42 earnedThe Bitcoin Supercycle Began In 2023: Bear Market Is Cancelled?! | EP 1267
28.2K -
 1:57:18
The Charlie Kirk Show
2 hours agoTen Years Ago Today + Israel Against Iran + Holding the ICE Line | Sen. Scott, Eric Trump | 6.16
52.6K20 -
 LIVE
LIVE
Badlands Media
12 hours agoY-Chromes Ep. 37
1,342 watching -
 2:24:47
Steven Crowder
4 hours agoTrump vs. Tucker: Is Israel Dragging the US into War vs. Iran
378K281