10- Map visualizations 2
4 years ago
1
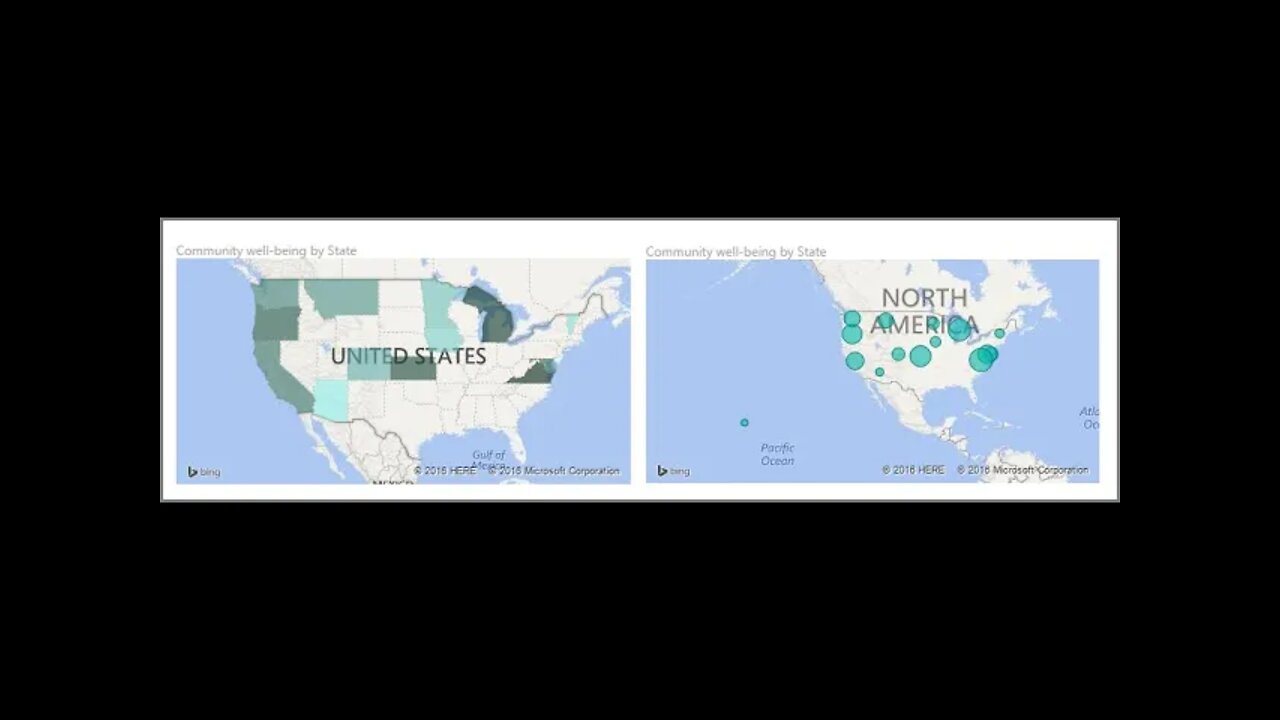
Create bubble maps
To create a bubble map, select the Map option in the Visualization pane. In the Visualizations options, add a value to the Location bucket to use a map visual.
Create shape maps
To create a shape map, select the Filled Map option in the Visualization pane. As with bubble maps, you must add a value to the Location bucket to use this visual. Add a field to the Size bucket to change the intensity of the fill color.
Loading comments...
-
 2:40:59
BlackDiamondGunsandGear
6 hours agoITS MA'AM!! / After Hours Armory / Are you threatening me?
18.3K4 -
 44:54
44:54
SouthernbelleReacts
8 days ago $1.12 earnedHIS RUG… I CAN’T STOP LAUGHING 🤣 | Big Lebowski Reaction
12.1K8 -
 2:17:46
megimu32
5 hours agoOFF THE SUBJECT: Reddit Meltdowns, Music Takes & Bodycam Breakdowns
40.4K11 -
 LIVE
LIVE
The Rabble Wrangler
11 hours agoRedSec with Mrs. Movies | The Best in the West Carries His Wife to Victory!
255 watching -
 2:40:59
DLDAfterDark
4 hours ago $4.64 earnedTrans Man's Death Threats To Christian Conservatives - Whistlin' Diesel Tax Evasion
23.3K3 -
 23:42
23:42
Robbi On The Record
2 days ago $7.00 earnedWhat's happening in the republican party?? BTS of Michael Carbonara for Congress
63.3K12 -
 4:53
4:53
PistonPop-TV
2 days ago $2.44 earnedThe G13B: The Tiny Suzuki Engine That Revved Like Crazy
13.1K1 -
 5:55:29
GritsGG
7 hours ago#1 Most Warzone Wins 4000+!
26.3K2 -
 1:58:31
Joker Effect
5 hours agoSTREAMER NEWS: WHAT IS JOKER DOING?! Where is the streamer space going now?! Q & A
15.1K3 -
 LIVE
LIVE
Eternal_Spartan
8 hours ago🟢 Eternal Spartan Plays Arc Raiders - New Updates! | USMC Veteran
98 watching