Found a New TradingView Indicator That is 10X Better Than Premium
Found a New TradingView Indicator That is 10X Better Than Premium
In this video, we will be introducing a new trading strategy on TradingView that works like magic. Many traders fail or quit trading due to poor indicator combinations or relying on indicators that only provide historical market information. To avoid these pitfalls, we will be using a combination of indicators to improve our understanding of market dynamics and generate profitable trade entries and exits.
To follow along, make sure you visit TradingView.com and select the Euro Japanese Yen pair on the five-minute timeframe. Let's start by adding the "Know Sure Thing" indicator, which is a momentum-based oscillator that smooths out data using Simple Moving Averages. This indicator calculates a final value that fluctuates above and below a Zero Line. We will adjust the settings by adding two band lines, one in green and one in red, to better visualize the indicator's movements. Additionally, we will change the zero line color to white for clarity.
Next, we will attach the "MACD" (Moving Average Convergence Divergence) indicator to the "Know Sure Thing" indicator. This allows us to identify overbought and oversold levels for trading. Adjust the settings by adding a lower band line in red and an upper band line in green to filter trade entries and exits effectively.
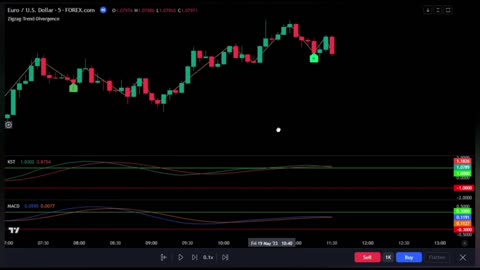
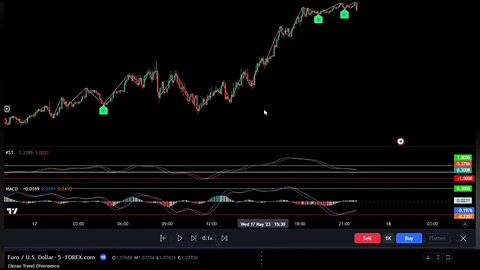
Finally, we will add the "Zigzag Trend Divergence" indicator, which detects divergence on the chart. Although we will disable some of its signals, we will use hidden divergences as our signal provider for buying and selling commodities in the market. Customize the settings to focus on hidden divergences and remove unnecessary elements from the chart.
To enter a buy trade, we look for both the KST indicator and MACD indicator to close above the upper band line, indicating strong upward momentum. We wait for a hidden divergence signal from the Zigzag Trend Divergence indicator and confirm it with the next two candlesticks. It's important to set a stop loss using a reliable indicator like ATR (Average True Range) or Chandelier Exit to protect against unfavorable market moves.
For a short trade, the KST and MACD indicators should cross below the lower band line, indicating bearish momentum. We then wait for a bearish hidden divergence signal from the Zigzag Trend Divergence indicator before entering the trade. As with buy trades, confirm the signal with the next two candlesticks and use a suitable stop loss strategy.
Remember, it's crucial to conduct thorough backtesting and forward testing before trading live. Following the trend and adjusting take profit levels based on risk can significantly improve your chances of success.
23
views
Buy Sell indicator tradingview scalping trading strategy for crypto, Forex Trading
Profitable indicators for trading
Biggest mistakes made with indicators
How to use indicators
Technical analysis for Forex
Technical analysis for trading
trading indicators for beginners
moving average indicator
moving average trading strategy for intraday
Bollinger Bands Trading Strategy
How to Trade Like a PRO
Swing Trading For Beginners
support and resistance indicator
support and resistance indicator free download
"5 minute scalping strategy"
"1 minute scalping strategy"
"profitable forex scalping strategy"
"best scalping indicator mt4"
"forex price action scalping strategy"
"5 min price action scalper system"
"price action scalper ea"
"candle scalping strategy"
"price action 15 min"
"forex 15 min scalping strategy"
"forex scalping profits"
"best scalping indicator in tradingview"
"1 minute scalping indicator"
"simple scalper strategy"
"forex trading profitable strategy"
"btc scalping strategy"
"powerful 1 min scalping system"
"best forex pairs to scalp 2022"
"scalp trading forex"
"scalping trading quora"
forex trend finder indicator that actually work
trading system
HOW TO GROW $100 TO $100,000 in few minutes
99.99% Accurate
8
views
I Found a New TradingView Indicator That is 10X
Found a New TradingView Indicator That is 10X Better Than Premium
In this video, we will be introducing a new trading strategy on TradingView that works like magic. Many traders fail or quit trading due to poor indicator combinations or relying on indicators that only provide historical market information. To avoid these pitfalls, we will be using a combination of indicators to improve our understanding of market dynamics and generate profitable trade entries and exits.
To follow along, make sure you visit TradingView.com and select the Euro Japanese Yen pair on the five-minute timeframe. Let's start by adding the "Know Sure Thing" indicator, which is a momentum-based oscillator that smooths out data using Simple Moving Averages. This indicator calculates a final value that fluctuates above and below a Zero Line. We will adjust the settings by adding two band lines, one in green and one in red, to better visualize the indicator's movements. Additionally, we will change the zero line color to white for clarity.
Next, we will attach the "MACD" (Moving Average Convergence Divergence) indicator to the "Know Sure Thing" indicator. This allows us to identify overbought and oversold levels for trading. Adjust the settings by adding a lower band line in red and an upper band line in green to filter trade entries and exits effectively.
Finally, we will add the "Zigzag Trend Divergence" indicator, which detects divergence on the chart. Although we will disable some of its signals, we will use hidden divergences as our signal provider for buying and selling commodities in the market. Customize the settings to focus on hidden divergences and remove unnecessary elements from the chart.
To enter a buy trade, we look for both the KST indicator and MACD indicator to close above the upper band line, indicating strong upward momentum. We wait for a hidden divergence signal from the Zigzag Trend Divergence indicator and confirm it with the next two candlesticks. It's important to set a stop loss using a reliable indicator like ATR (Average True Range) or Chandelier Exit to protect against unfavorable market moves.
For a short trade, the KST and MACD indicators should cross below the lower band line, indicating bearish momentum. We then wait for a bearish hidden divergence signal from the Zigzag Trend Divergence indicator before entering the trade. As with buy trades, confirm the signal with the next two candlesticks and use a suitable stop loss strategy.
Remember, it's crucial to conduct thorough backtesting and forward testing before trading live. Following the trend and adjusting take profit levels based on risk can significantly improve your chances of success.
19
views

CPR Pivot Points Strategy Exposes Biggest Trading
🔵 Trading platform I use. https://www.gate.io/signup/U1kXVAwJ?r...
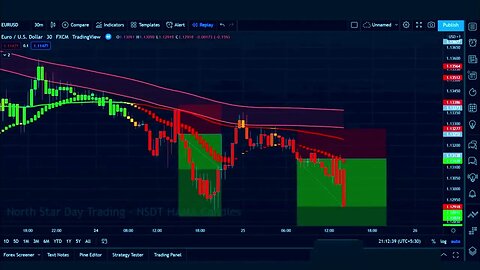
This video presents a trading strategy that utilizes three powerful indicators to identify high-probability trade setups and improve traders' fortunes. The CPR indicator, which stands for Central Pivot Range, is used to identify price level pivot points. The Ichimoku Cloud is used to gauge momentum and future areas of support and resistance, while the Stochastic Momentum Index (SMI) or Money Flow Index is used to perfect entries and exits. The video walks traders through the process of adding and adjusting these indicators on the TradingView charting platform. Traders are taught to enter buy trades when the baseline is above the recent pivot point and to enter sell trades when the baseline is below the recent pivot point. The final confirmation to enter a trade is when the SMI line crosses below the signal line while both remain above the centerline, and when the SMI changes to a darker blue. Traders are also advised to only open trades when price action is between the baseline and pivot point and to manage open trades properly.
24
views

CPR Pivot Points Strategy Exposes Biggest Trading
🔵 Trading platform I use. https://www.gate.io/signup/U1kXVAwJ?ref_type=103
This video presents a trading strategy that utilizes three powerful indicators to identify high-probability trade setups and improve traders' fortunes. The CPR indicator, which stands for Central Pivot Range, is used to identify price level pivot points. The Ichimoku Cloud is used to gauge momentum and future areas of support and resistance, while the Stochastic Momentum Index (SMI) or Money Flow Index is used to perfect entries and exits. The video walks traders through the process of adding and adjusting these indicators on the TradingView charting platform. Traders are taught to enter buy trades when the baseline is above the recent pivot point and to enter sell trades when the baseline is below the recent pivot point. The final confirmation to enter a trade is when the SMI line crosses below the signal line while both remain above the centerline, and when the SMI changes to a darker blue. Traders are also advised to only open trades when price action is between the baseline and pivot point and to manage open trades properly.
🔵 Trading platform I use. https://www.gate.io/signup/U1kXVAwJ?ref_type=103
14
views