4 days agoTRADINGLITE HEATMAP TUTORIAL - How to Trade Crypto Using Heatmaps on TradingLiteTrading_Soldier
8 days agoAssuming everyone is familiar with the Citizens Ratification Branch (CRB), here's how they can...CitizensRatificatioORG
1 month agoRussia's Su-34 fighter-bombers hit AFU command post and manpower with a FAB-500deNAZIfication - Special Military QperationZ WORLDWIDE
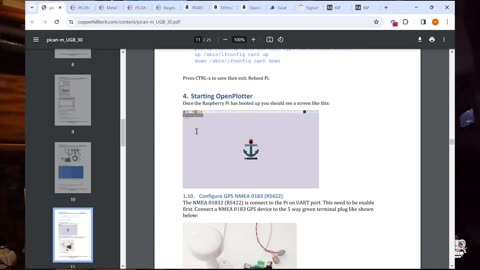
1 month agoSailing Goat Tech Series: Raspberry Pi Data Server Setup for NMEA 2000 | Custom Dashboard TutorialsvGoat
2 months agoHow BIM enhances project collaboration, coordination, and communication among stakeholders Part.No 2QuantumBuild
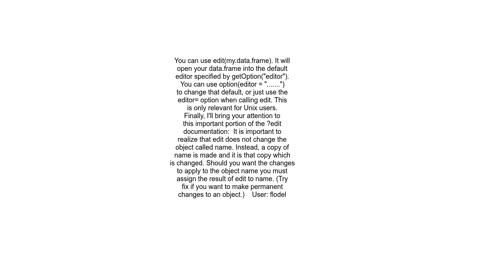
2 months agoHow to visualize feasible region for linear programming with arbitrary inequalities in NumpyMatploMixible
2 months ago165. Visualize Your Prompts with Promptomania | Skyhighes | Prompt EngineeringSkyhighes Education
2 months ago115. ChatGPT Plugins Visualize Information with the Show Me Plugin | Skyhighes | Prompt EngineeringSkyhighes Education
2 months agoSmart City End to End Realtime Data Engineering Project | Get Hired as an AWS Data EngineerCodeWithYu