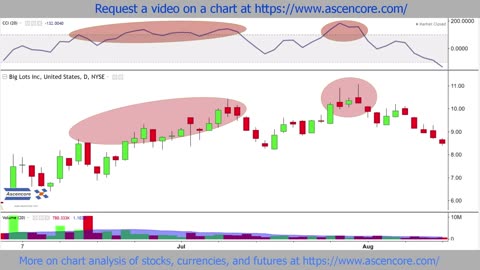
5 months agoBig Lots (BIG) Stock Market Chart Technical Analysis With The Commodity Channel IndexAscencore
6 months agoNASDAQ Composite Stock Chart Accumulation Swing Index (ASI) Indicator Analysis ExampleAscencore
7 months agoFINAL Market ‘SUCKER’ Rally! Bo Polny, Andrew Sorchini, Dave ScarlettGOLD2020ForecastVerified
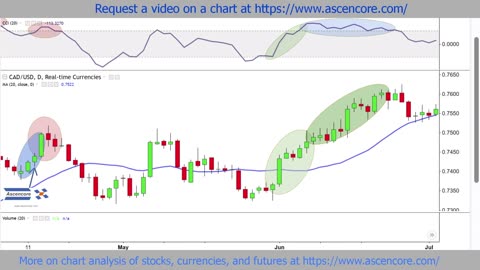
5 months agoCanadian Dollar To US Dollar (CAD to USD) Technical Analysis With The Commodity Channel IndexAscencore
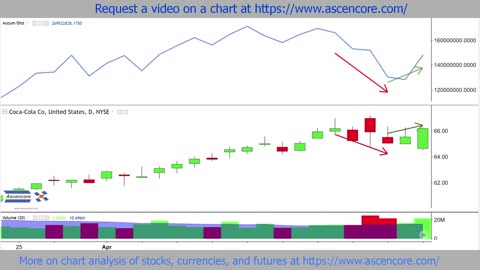
6 months agoExplaining The Accumulation Distribution AD Indicator An Analysis Of Coca-Cola Stock ChartAscencore
2 years agoCrypto, Forex, Futures, and Stocks - Live Market Analysis, Price Prediction, Day Trade Ideasitsjustanalysis
2 years agoCrypto, Forex, Futures, and Stocks - Live Market Analysis, Price Prediction, Day Trade Ideasitsjustanalysis
3 years agoTechnology Stocks PRESS HIGHER (Here's What To Watch) | Stock Market AnalysisFiguring Out Money
6 months agoToronto Dominion Bank (TD) Stock Chart Analysis With The Accumulation Distribution AD IndicatorAscencore