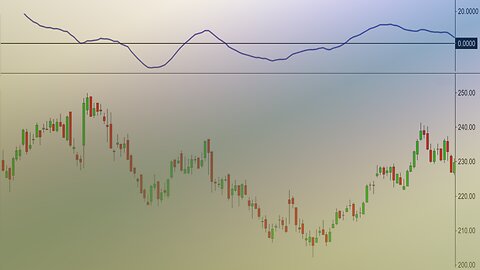
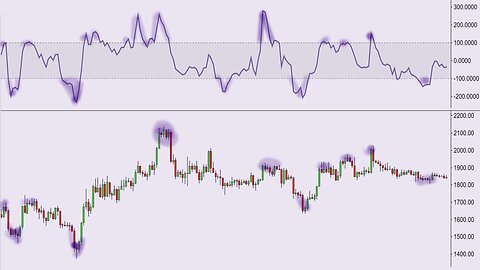
1 year agoDOW, Zoom, Silver, & Gold Chart Comparisons With The Correlation Coefficient IndicatorAscencore
6 months agoBest Crypto Wallets (Open Source Bitcoin Software Wallets (Private, Secure, & Beginner Friendly))Ascencore
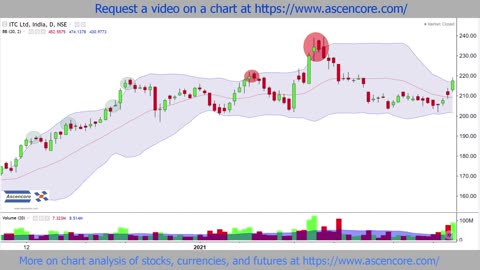
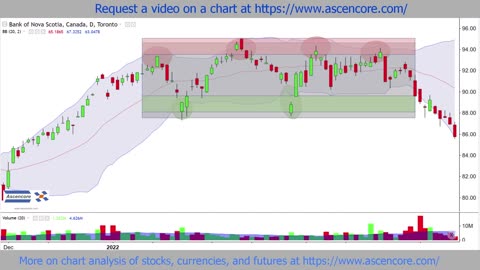
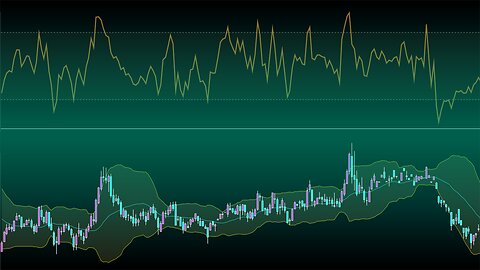
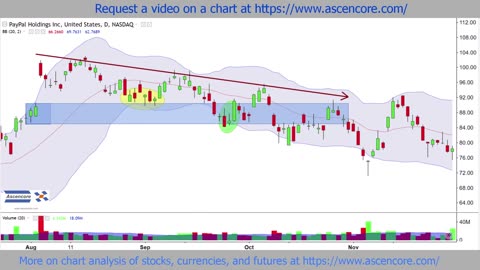
1 year agoHow To Use Bollinger Bands To Analyze Trend Continuations And Changes In VolatilityAscencore
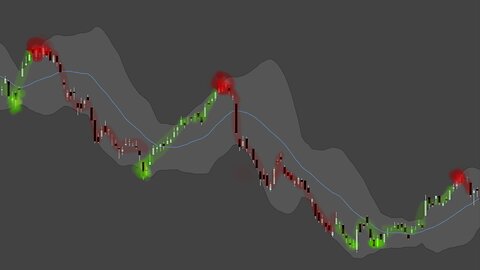
1 year agoStock Chart Technical Analysis (Bearish KickerKicking) Candlestick Chart Pattern AnalysisAscencore
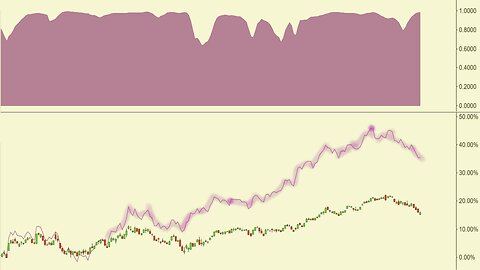
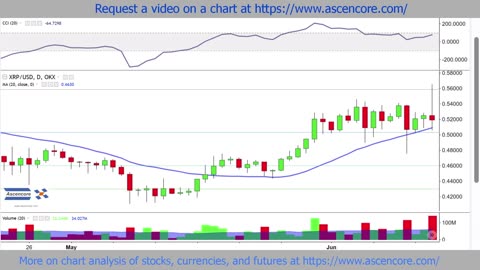
1 year agoRipple To US Dollar (XRP to USD) Technical Analysis With The Commodity Channel IndexAscencore
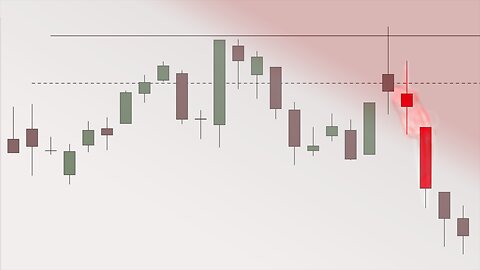
1 year agoStock Chart Technical Analysis (Bearish Shooting Star) Candlestick Chart Pattern AnalysisAscencore