4 years agoAnalysing UFO Time of Day and Length of Encounter Report Trends with Python (NUFORC Data)Matea Vasileski
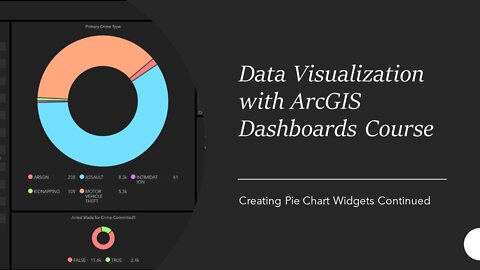
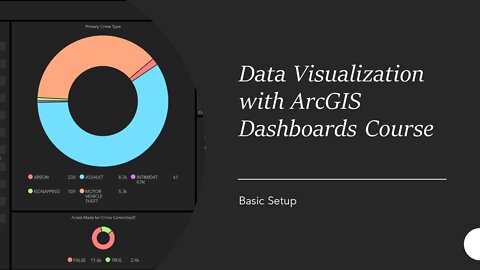
3 years ago04 - Creating First Pie Chart Widgets: ArcGIS Dashboards with Chicago Crime DataLearn with MJ
3 years ago06 - Building Serial Chart Widgets: ArcGIS Dashboards with Chicago Crime DataLearn with MJ
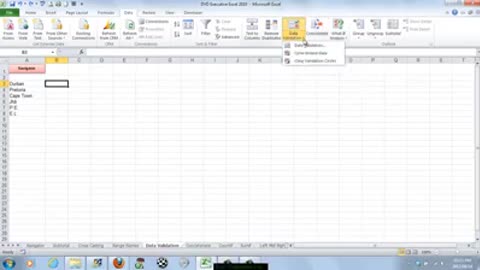
4 years agoCreate On Sheet Excel User Forms With Smart Data Mapping [Employee Manager Part 6]Excel For Freelancers
1 year agoSteve Kirsch Validates The NZ Whistleblower's Dashboard On Twitter Spaces Dec 9.welcometheeagle
1 year agoMSM News Admits CDC Data Shows “Boosted” Americans Catching COVID-19The Rio Times: Latin America and Alternative Narratives
2 years agoXen Dashboard By XenTurbo Looks Epic! Track Your Xen Portfolio, Minting Costs & Xen Market!The Kryptonite Show
3 years ago03 - Date Picker Widget Configuration and Theme Config: ArcGIS Dashboards with Chicago Crime DataLearn with MJ


![Create On Sheet Excel User Forms With Smart Data Mapping [Employee Manager Part 6]](https://1a-1791.com/video/s8/1/_/7/e/t/_7etb.oq1b.2-small-Create-On-Sheet-Excel-User-.jpg)