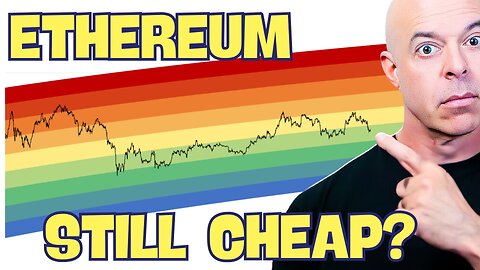
2 months agoIs Ethereum $ETH still a bargain? According to the rainbow chart, it's practically on sale!Crypto for the Rest of Us
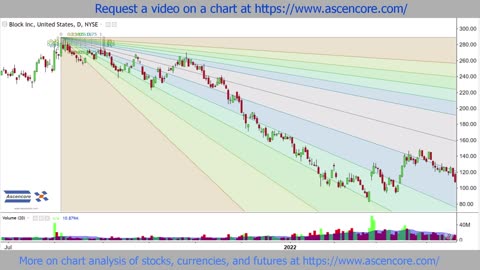
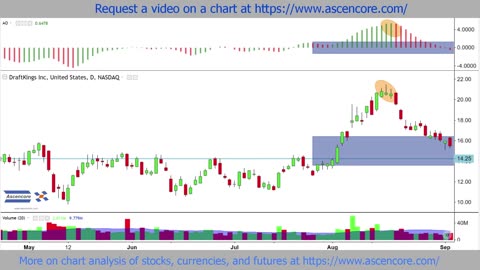
1 year agoStock Chart Technical Analysis (Dark Cloud Cover) Candlestick Chart Pattern AnalysisAscencore
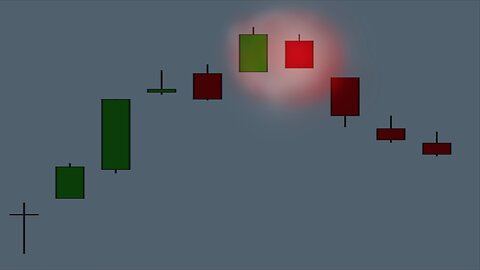
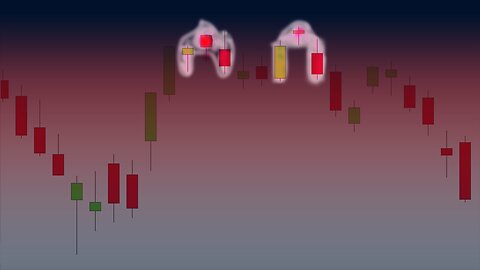
1 year agoStock Chart Technical Analysis (Bearish Harami) Candlestick Chart Pattern AnalysisAscencore
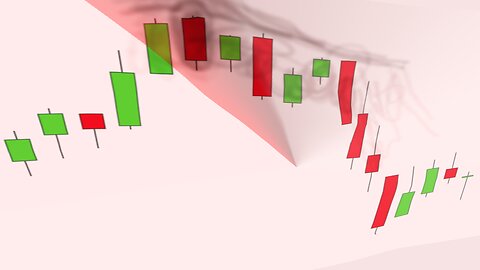
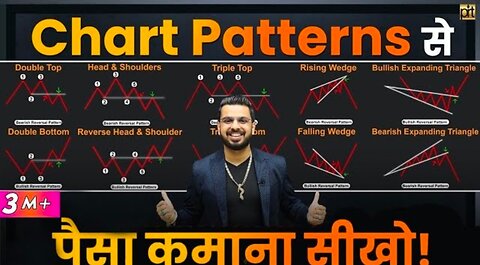
4 months agoFree Chart Patterns Course | Reversal Chart Patterns | technical Analysis in Stock MarketAr0ra
2 days agoExplosive Moves Incoming? Bitcoin, Google, Fartcoin & Ethereum Chart AnalysisUnleash your inner trader with Team NakedTrader!
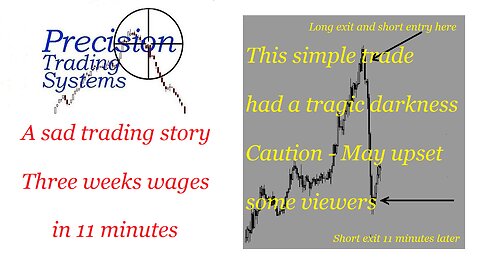
3 months agoThree weeks wages in 11 minutes assisted by the Early Warning indicator- Viewer discretion advised.PrecisionTradingSystems
4 years agoSTOCK MARKET TAKES A SEPTEMBER BREATH...WILL THE MELT UP CONTINUE, OR ARE WE IN A BULL TRAP?Figuring Out Money
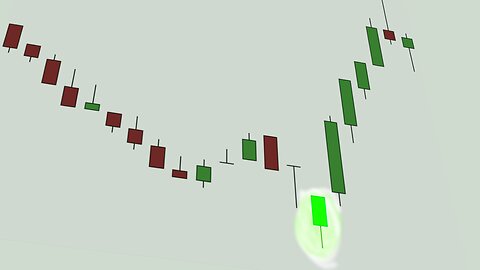
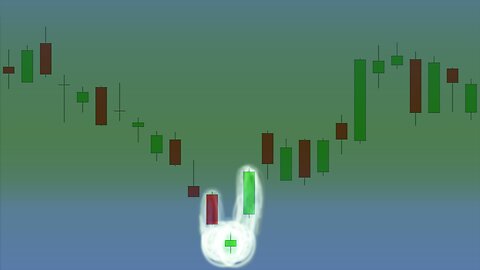
1 year agoStock Chart Technical Analysis (Bullish Engulfing) Candlestick Chart Pattern AnalysisAscencore
1 year agoStock Chart Technical Analysis (Gravestone Doji) Candlestick Chart Pattern AnalysisAscencore
1 year agoStock Chart Technical Analysis (3 Advancing Soldiers) Candlestick Chart Pattern AnalysisAscencore