11 days agoES MES Key Levels. Where Are We At? Chart Analysis. Micros Trading System. Wednesday "AM Briefing"MicrosTrader: Learn to Scalp ES MES Futures
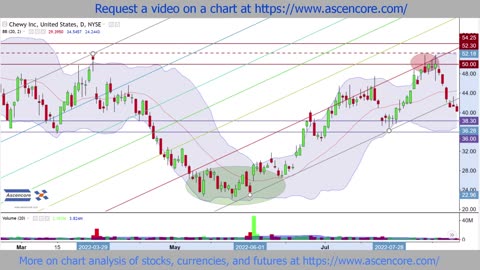
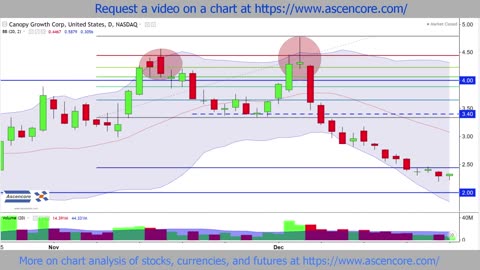
11 months agoStock Chart Technical Analysis (Dark Cloud Cover) Candlestick Chart Pattern AnalysisAscencore
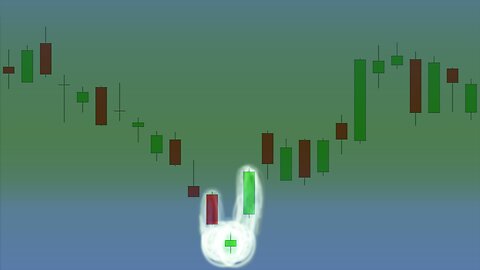
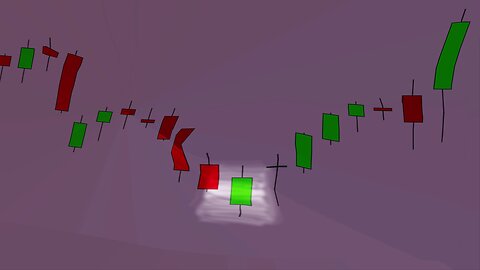
11 months agoStock Chart Technical Analysis (Morning Star) Candlestick Chart Pattern AnalysisAscencore
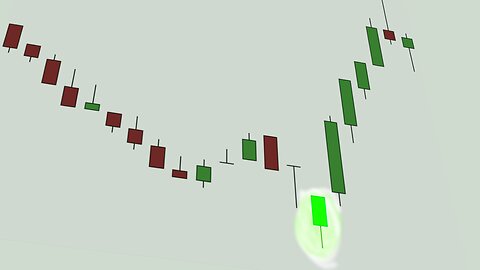
11 months agoStock Chart Technical Analysis (Bull Hammer) Candlestick Chart Pattern AnalysisAscencore
5 months agoFinance chart stock - 4k, Free Stock Footage, Copyright Free, Background, Loop 15-secStock Video Download
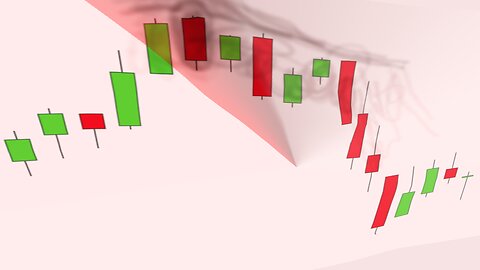
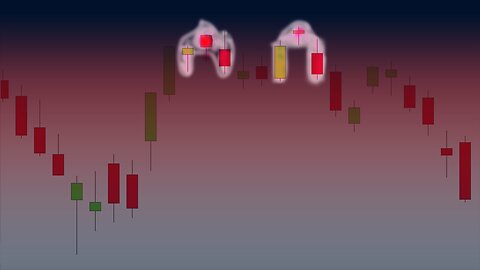
11 months agoStock Chart Technical Analysis (Evening Star) Candlestick Chart Pattern AnalysisAscencore
11 months agoStock Chart Technical Analysis (Bullish Engulfing) Candlestick Chart Pattern AnalysisAscencore
11 months agoStock Chart Technical Analysis (Gravestone Doji) Candlestick Chart Pattern AnalysisAscencore
18 days agoES MES Key Levels. Where Are We At? Chart Analysis. Micros Trading System. Wednesday "AM Briefing"MicrosTrader: Learn to Scalp ES MES Futures