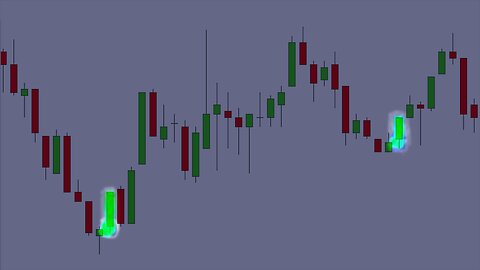
5 months agoStock Chart Technical Analysis (Gravestone Doji) Candlestick Chart Pattern AnalysisAscencore
5 months agoStock Chart Technical Analysis (3 Methods Rising) Candlestick Chart Pattern AnalysisAscencore
5 days agoStock Market Analysis with Phil Grande of Phil's Gang Radio Show 06/14/2024The Phil's Gang Radio Show Channel
20 hours agoBitcoin: This Week's Price Action Analysis And Forecast.Cryptocurrency Analysis & Signals.
2 months agoBBN, Mar 29, 2024 – NEW ANALYSIS details: Moscow terror attack, Baltimore bridge...Health Ranger Report
5 months agoStock Chart Technical Analysis (Bullish KickerKicking) Candlestick Chart Pattern AnalysisAscencore
5 months agoLuckin Coffee (LKNCY) Stock Chart Analysis Fibonacci Channel Time Analysis ExampleAscencore
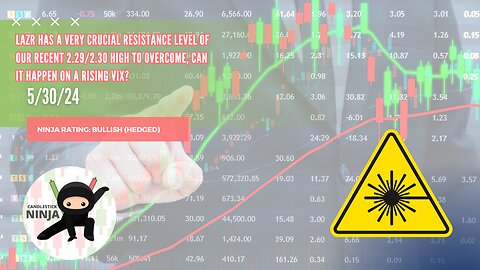
20 days agoLAZR Stock Analysis: Breaking Out of the Wedge but with a Rising VIX Candlestick NinjaCandlestick Ninja TV
3 years agoSHOULD YOU PLAY THIS BREAKOUT!? (CONSIDER THIS) | SHOPIFY STOCK ANALYSIS | SHOPFiguring Out Money
6 months agoNASDAQ Composite Stock Chart Accumulation Swing Index (ASI) Indicator Analysis ExampleAscencore