1 day agoTrump’s Trillion-Dollar AI Takeover: Saudi Money, Big Tech Deals, and End of State Power?Voice Of Rural AmericaVerified
2 months agoWhy has the Dutch government been secretive about PALANTIR's data analysis since 2011? - Original (on Youtube) = Dutch spoken with English subtitles. Rumble suddenly uses auto narration in English. WHY???? I ain't got a clueRAVries
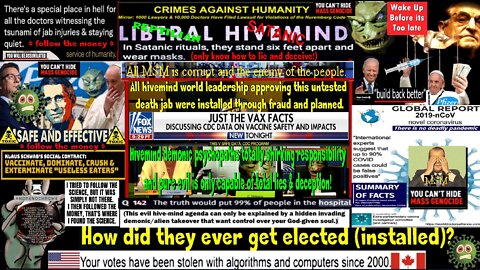
2 years agoV-SAFE Covid Vaccine Injury Data Shows 7.7% Seek Medical Care After Vax, 25% Had Serious Side EffectsTruths UnlimitedVerified
1 year agoEpisode 2310 Scott Adams: CWSA 12/02/23 Don't Miss My James Carville Impression, Pre-Trumpers, MoreReal Coffee With Scott AdamsVerified
27 days ago3I/ATLAS's Orbit UNCHANGED by Massive Ongoing Solar Explosions 💥 Latest Breaking UpdatesSierraDelta
13 days agoLIVE 24/7 • Crypto News • Tickers • Market Alerts • Tap the Bell for Updates24/7 Market Tracker & Prices
3 years agoCalculated CDC Data: 88MM People Had An Adverse Event in US Alone! 20.2MM Needed Med Care after VaxThe Ben Armstrong ShowVerified
3 years agoCalculated CDC Data: 88MM People Had An Adverse Event in US Alone! 20.2MM Needed Med Care after VaxThe New AmericanVerified
3 years agoCalculated CDC Data 88MM People Had An Adverse Event in US Alone! 20.2MM Needed Med Care after VaxRight2Freedom
2 years agoAre Workers Being Paid Their Product? Watch Out for Misleading ChartsMises InstituteVerified
1 year agoThe Future of Microscopy - 3D Phase Array Tomography Scanning Electron MicroscopyDrRobertYoung
9 months agoGet equipped for 6 million new jobs in Artificial Intelligence, Data Science & BlockchainZeeshan Usmani
5 months agoSeeing the Unseen: Advanced Data Visualization Uncovers Hidden Structures in Complex...mightytravels_premium
5 months agoThe Role of Data Visualization in Decoding International Travel Visasmightytravels_premium
2 years ago#358 | Pentagon Leak Raid, Tiffany Dover Strikes Back, Bob Lee Murder Arrest | Matt & Blonde ShowMatt ChristiansenVerified
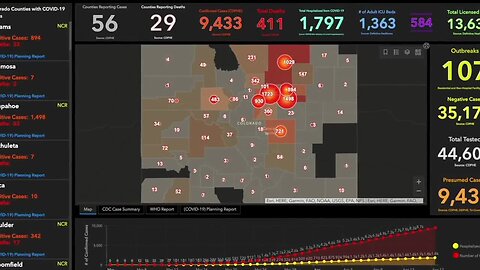
2 years agoCDC Reporting System for COVID-19 Injuries & Deaths Missing, Hidden or Inaccurate!Right2Freedom
3 years agoBREAKING: ICAN Wins Lawsuit Forcing CDC to Turn Over V-SAFE Covid Vaccine Injury Data –MyCatholicRedPill