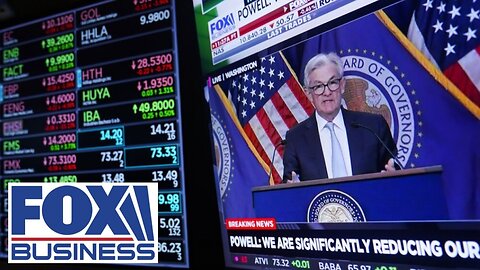
1 month agoMonica Crowley: Global recession likely on the horizon following stock market carnageJust the NewsVerified
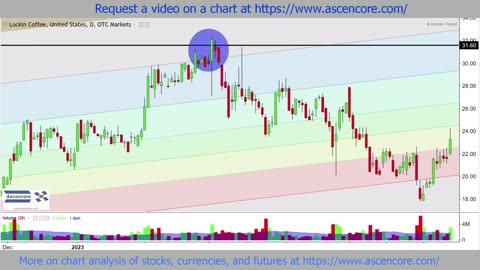
8 months agoLuckin Coffee (LKNCY) Stock Chart Analysis Fibonacci Channel Time Analysis ExampleAscencore
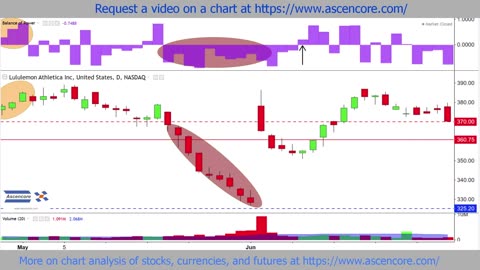
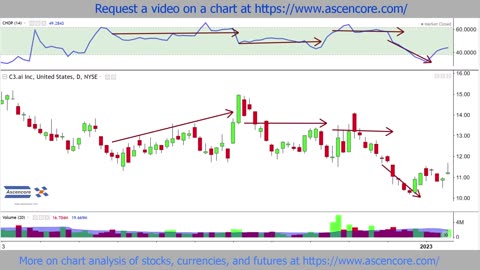
8 months ago(LULU) Stock Chart Analysis Of Defined Gaps & Trading Ranges With The Balance Of Power IndicatorAscencore
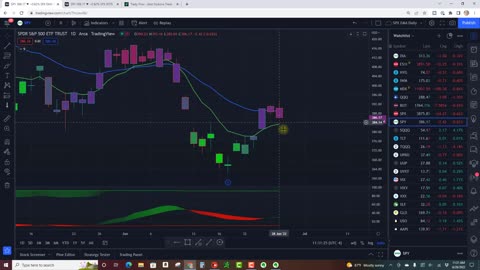
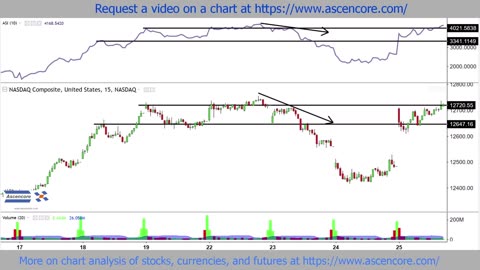
9 months agoNASDAQ Composite Stock Chart Accumulation Swing Index (ASI) Indicator Analysis ExampleAscencore
8 months agoStock Chart Technical Analysis (Bullish Engulfing) Candlestick Chart Pattern AnalysisAscencore