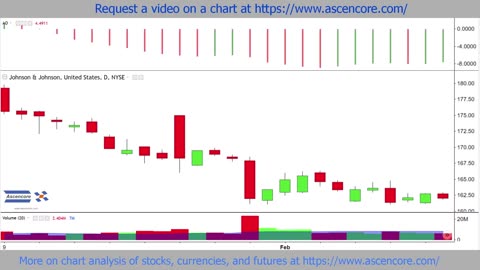
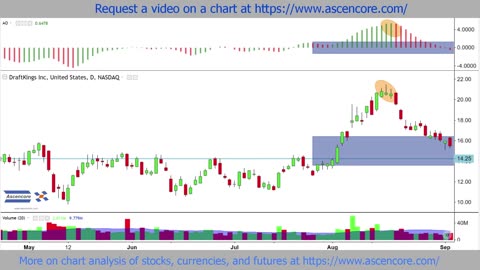
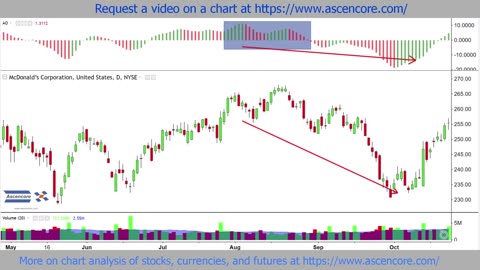
1 year agoStock Chart Technical Analysis With Candlestick Chart Pattern (Explained Using Real Examples)Ascencore
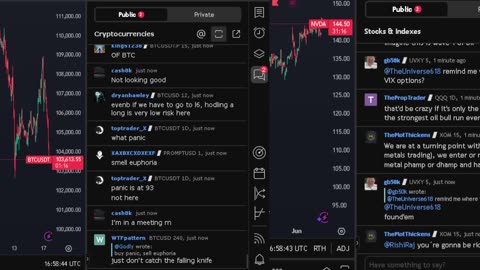
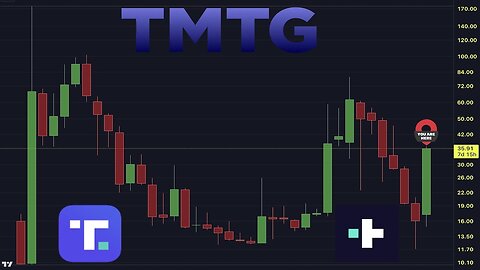
12 watching2 days agoDJT STOCK & CRYPTO CHARTS LIVE RUM BTC ETH XRP SOL GOLD SILVERDelta RadioVerified
1 year agoSen. Ron Johnson Shares the Most Censored Chart in Congressional HistoryVigilant FoxVerified
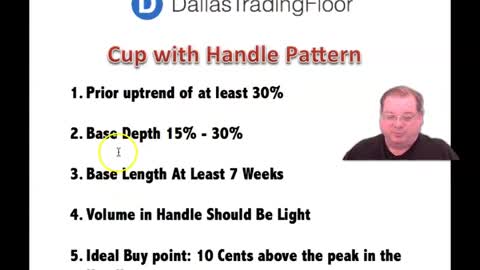
4 years agoCup with Handle, Double Bottom and Flat Bast the tree most profitable stock chart patternsDallas Trading Floor
1 year agoStock Chart Technical Analysis (3 Methods Rising) Candlestick Chart Pattern AnalysisAscencore
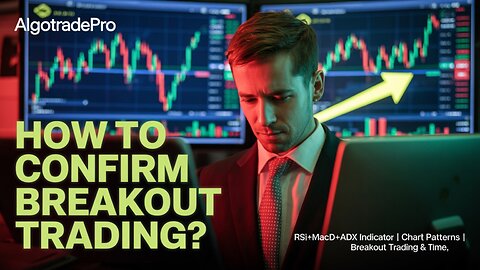
3 days agoHow to Confirm Breakout Trading? | RSI+MACD+ADX Indicator | Chart Patterns | Breakout Trading & TimeFinsteon Finance
1 year agoBearish Continuations On Stock Charts With The Awesome Oscillator Saucer Setup ExampleAscencore
1 year agoStock Chart Technical Analysis (Dark Cloud Cover) Candlestick Chart Pattern AnalysisAscencore
21 hours agoNVIDIA stock price live, FOREX, EUR USD, GBP USD, JPY USD, CAD USD, AUD USD, NVIDIA share price liveStock Market Live Charts
1 year agoStock Chart Technical Analysis (Bullish Engulfing) Candlestick Chart Pattern AnalysisAscencore
11 months agoFinance chart stock - 4k, Free Stock Footage, Copyright Free, Background, Loop 15-secStock Video Download
1 year agoMcDonald’s (MCD) Stock Chart Analysis With The Awesome Oscillator Twin Peaks SetupAscencore
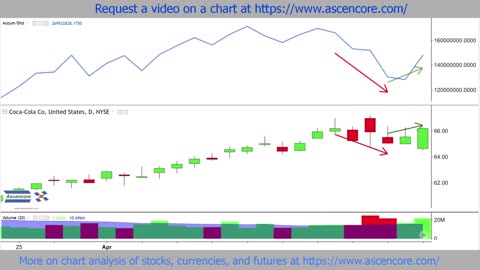
1 year agoExplaining The Accumulation Distribution AD Indicator An Analysis Of Coca-Cola Stock ChartAscencore
 12 watching