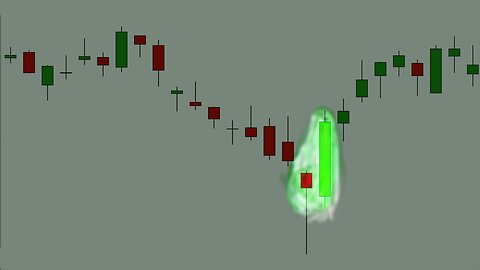
5 months agoStock Chart Technical Analysis (Bullish Engulfing) Candlestick Chart Pattern AnalysisAscencore
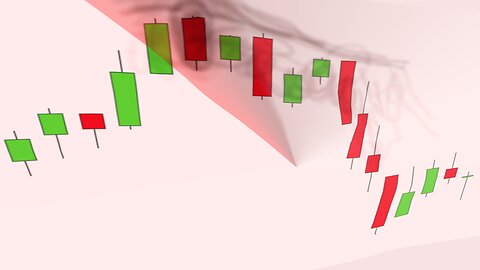
5 months agoStock Chart Technical Analysis (Dark Cloud Cover) Candlestick Chart Pattern AnalysisAscencore
5 months agoStock Chart Technical Analysis (3 Methods Rising) Candlestick Chart Pattern AnalysisAscencore
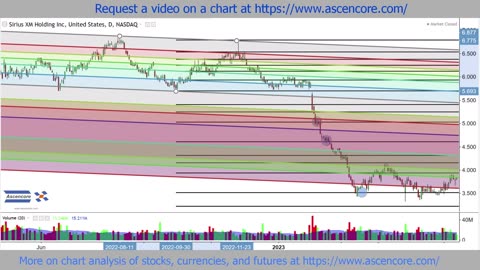
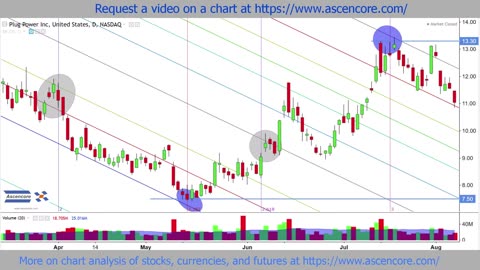
4 months agoFibonacci Channels Combined With Retracements For Time Analysis SIRI Stock Chart ExampleAscencore
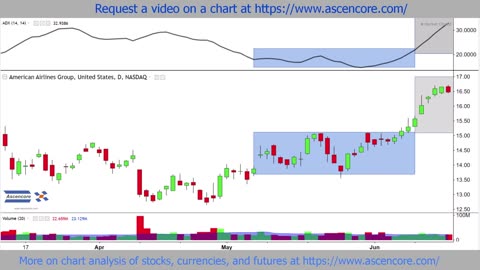
5 months ago(LULU) Stock Chart Analysis Of Defined Gaps & Trading Ranges With The Balance Of Power IndicatorAscencore
4 months agoLuckin Coffee (LKNCY) Stock Chart Analysis Fibonacci Channel Time Analysis ExampleAscencore
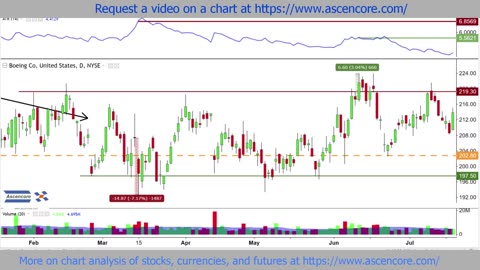
5 months agoStock Chart Technical Analysis With Candlestick Chart Pattern (Explained Using Real Examples)Ascencore
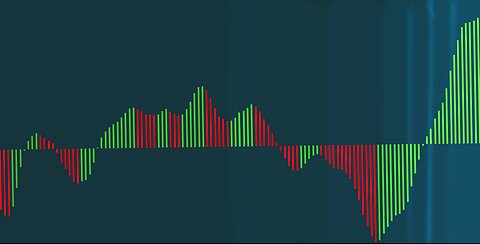
6 months agoNASDAQ Composite Stock Chart Accumulation Swing Index (ASI) Indicator Analysis ExampleAscencore
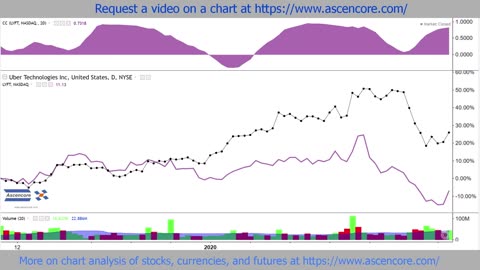
5 months ago(UBER) vs (LYFT) Stock Chart Comparison With The Correlation Coefficient IndicatorAscencore