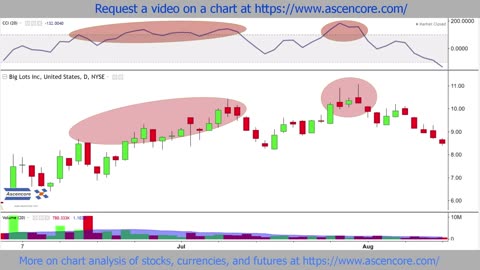
5 months agoBig Lots (BIG) Stock Market Chart Technical Analysis With The Commodity Channel IndexAscencore
5 months agoLuckin Coffee (LKNCY) Stock Chart Analysis Fibonacci Channel Time Analysis ExampleAscencore
6 months ago(LULU) Stock Chart Analysis Of Defined Gaps & Trading Ranges With The Balance Of Power IndicatorAscencore
6 months agoNASDAQ Composite Stock Chart Accumulation Swing Index (ASI) Indicator Analysis ExampleAscencore
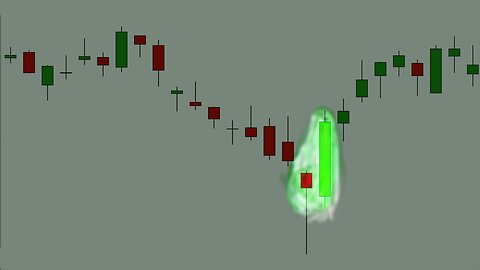
5 months agoStock Chart Technical Analysis (Bullish Engulfing) Candlestick Chart Pattern AnalysisAscencore
6 months agoIntel (INTC) Stock Chart Analysis Using The Arnaud Legoux Moving Average (ALMA) IndicatorAscencore
6 months ago(BBY) Best Buy Stock Chart Analysis With The Chande Momentum Oscillator & Bollinger BandsAscencore