16 days agoStock Market Analysis with Phil Grande of Phil's Gang Radio Show 05/31/2024The Phil's Gang Radio Show Channel
2 days agoStock Market Analysis with Phil Grande of Phil's Gang Radio Show 06/14/2024The Phil's Gang Radio Show Channel
9 days agoStock Market Analysis with Phil Grande of Phil's Gang Radio Show 06/07/2024The Phil's Gang Radio Show Channel
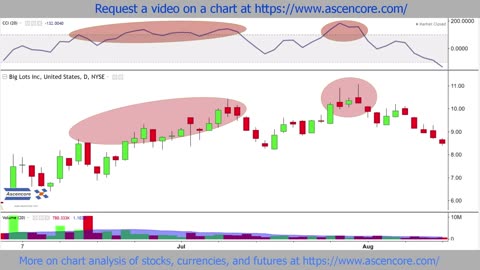
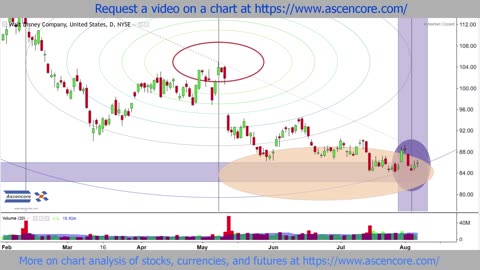
5 months agoBig Lots (BIG) Stock Market Chart Technical Analysis With The Commodity Channel IndexAscencore
3 months agoLIVE Stock Market Coverage & Analysis - TRADING & INVESTING - Martyn Lucas InvestorMartyn Lucas InvestorVerified
6 months agoStock Market Analysis with Phil Grande of Phil's Gang Radio Show 12/01/2023The Phil's Gang Radio Show Channel
23 days agoStock Market Analysis with Phil Grande of Phil's Gang Radio Show 05/24/2024The Phil's Gang Radio Show Channel
2 months agoStock Market Analysis with Phil Grande of Phil's Gang Radio Show 03/22/2024The Phil's Gang Radio Show Channel
6 months agoStock Market Analysis with Phil Grande of Phil's Gang Radio Show 11/27/2023The Phil's Gang Radio Show Channel
2 months agoStock Market Analysis with Phil Grande of Phil's Gang Radio Show 04/12/2024The Phil's Gang Radio Show Channel
4 months agoStock Market Analysis with Phil Grande of Phil's Gang Radio Show 02/16/2024The Phil's Gang Radio Show Channel
4 months agoStock Market Analysis with Phil Grande of Phil's Gang Radio Show 01/17/2024The Phil's Gang Radio Show Channel
4 months agoStock Market Analysis with Phil Grande of Phil's Gang Radio Show 01/24/2024The Phil's Gang Radio Show Channel
4 months agoLuckin Coffee (LKNCY) Stock Chart Analysis Fibonacci Channel Time Analysis ExampleAscencore