6 months agoNASDAQ Composite Stock Chart Accumulation Swing Index (ASI) Indicator Analysis ExampleAscencore
1 month agoTLRY Stock - Tilray Brands - TECHNICAL CHART ANALYSIS - Martyn Lucas InvestorMartyn Lucas InvestorVerified
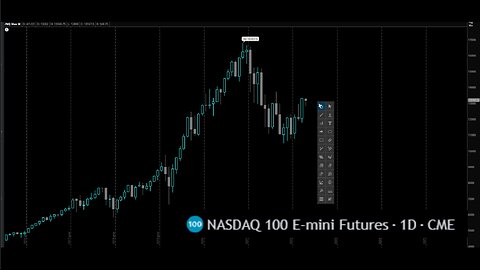
5 months agoDecoding Market Moves: In-Depth Technical Analysis of $NQ (Nasdaq 100 E- Mini Futures)BeniznaCapital
10 months agoSierra Chart Giveaway Update - No Trade Day ⚪| Nasdaq Analysis Futures Trading LiveMv3 Trader