11 days agoYou need to start learning and using Monitoring for your services and servers right now.ValtersIT
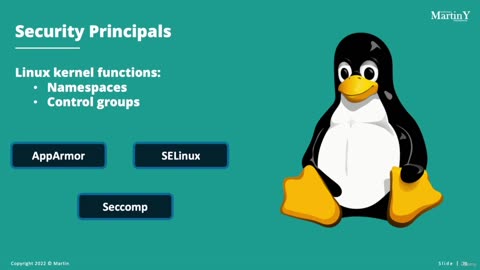
1 month agoList Namespace name Namespace Age and Status on Grafana using PromQL prometheus from Kubernetes MetTechSphere