2 years agoExcel 2016 Waterfall Chart - Advantages and Limitations - Ultimate guide to Excel's Bridge GraphLeila Gharani
2 years agoEasiest Excel Waterfall Chart (Bridge graph) from Scratch - Works with minus valuesLeila Gharani
3 years agoPatterns in Harmful Toxic COVID Vaccines (Moderna, Pfizer, Johnson)Censored Important Videos
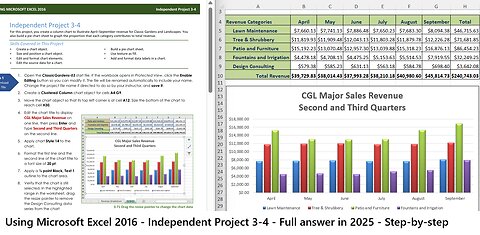
1 month agoUSING MICROSOFT EXCEL 2016 - Independent Project 3-4 - Classic Garden - Full answer in 2025saxi753
18 days agoThe Top 10 Excel Inventory Management Hacks You Need To Know - WITHOUT VBAExcel For Freelancers
2 years agoAUSTRALIAN DEATHS ARE OFF THE CHARTS & GLOBO VS HUMAN - DIRECT COMPARISON (SHARE)Humanity Is Under Attack
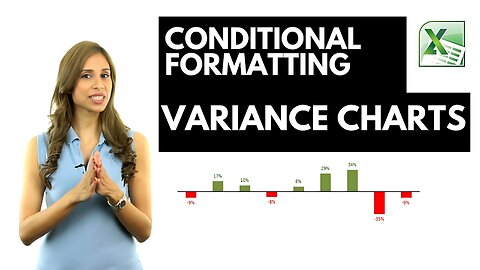
2 years agoBetter Excel Variance Charts to show percentage change (Simple & uncommon technique)Leila Gharani
2 years agoExcel Arrow Variance Chart: Dynamic Arrows in Chart to Show Change to Previous Year / BudgetLeila Gharani
6 years agoNew Information on 5g Near You & Dirty Secret Inside Telecommunications BillLeak ProjectVerified