2 years agoExplosive: Dr. Peter McCullough & John Leake Interview Dr. Aseem MalhotraSunfellow On COVID-19
2 years agoBetter Excel Variance Charts to show percentage change (Simple & uncommon technique)Leila Gharani
1 month agoIllustrated Excel 2019 | Module 2: End of Module Project 1| Hargrove Home Improvement (Update 2025)saxi753
2 years agoDynamic WordArt in Excel with Bar in Bar Chart (Info-chart that shows % completion)Leila Gharani
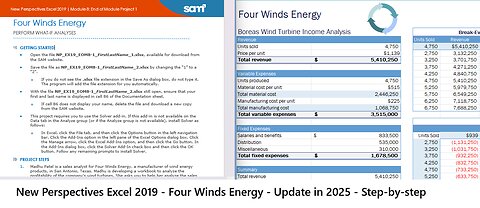
1 month agoNew Perspectives Excel 2019 | Module 8: End of Module Project 1 | Four Winds Energysaxi753
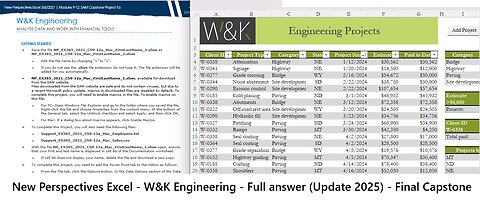
1 month agoNew Perspectives Excel 365/2021 | Modules 9-12: SAM Capstone Project 1a | W&K Engineeringsaxi753
4 months agoI Replaced My $200/Year Investment App With Excel — Here’s What HappenedExcel For Freelancers