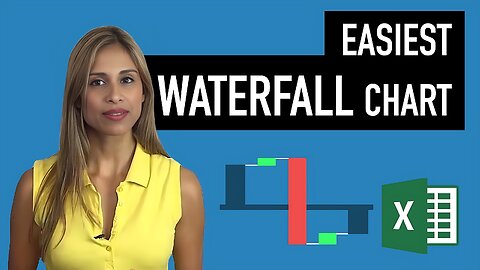
2 years agoEasiest Excel Waterfall Chart (Bridge graph) from Scratch - Works with minus valuesLeila Gharani
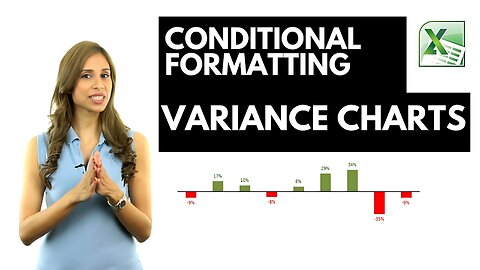
2 years agoBetter Excel Variance Charts to show percentage change (Simple & uncommon technique)Leila Gharani
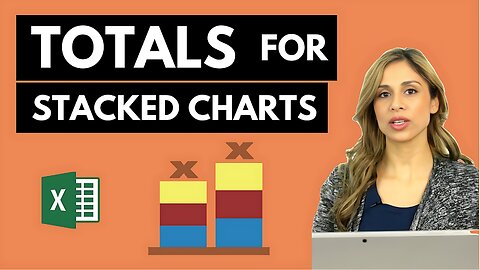
2 years agoHighlight Max & Min Values in an Excel Line Chart (Conditional Formatting in Charts)Leila Gharani
2 years agoExcel Arrow Variance Chart: Dynamic Arrows in Chart to Show Change to Previous Year / BudgetLeila Gharani
2 years agoExcel 2016 Waterfall Chart - Advantages and Limitations - Ultimate guide to Excel's Bridge GraphLeila Gharani
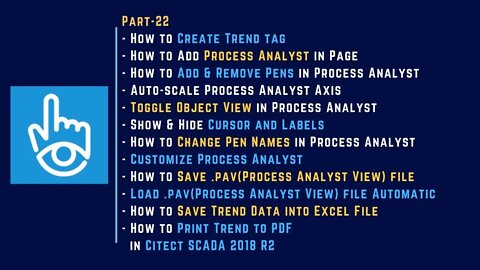
3 years agoPart-22 | Trend & Process Analyst | Use of .pav File | Auto-load .pav File | Citect SCADA 2018 R2 |Fusion Automate