2 years agoAUSTRALIAN DEATHS ARE OFF THE CHARTS & GLOBO VS HUMAN - DIRECT COMPARISON (SHARE)Humanity Is Under Attack
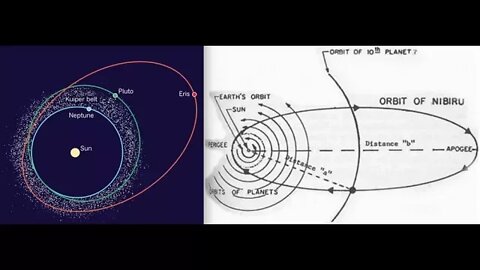
8 years agoComparison of Planet X & 9 Orbital Chart & Cataclysm Timelines, Latest 2017Leak ProjectVerified
2 years agoROBINHOOD Comparison CHART WOW! - Hood Stock - TRADING & INVESTING - Martyn Lucas InvestorMartyn Lucas InvestorVerified
2 years agoTrading Platform Comparison: Charting Software Edition | TradingView vs. WeBull vs. eSignal [2023]Clay TraderVerified
4 years agoCar companies chart comparison selecting which to trade shares June 10 2021Petes Investing
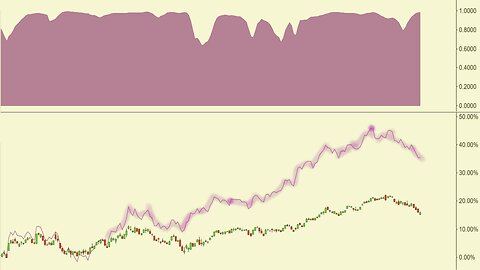
1 year agoDOW, Zoom, Silver, & Gold Chart Comparisons With The Correlation Coefficient IndicatorAscencore
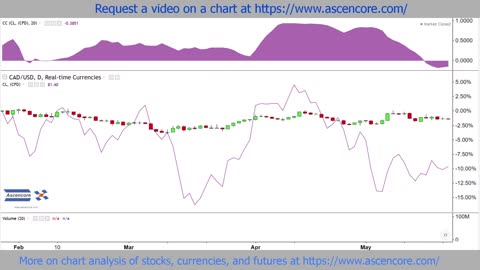
1 year agoCADUSD, Crude Oil, & Gold, Chart Comparisons With The Correlation Coefficient IndicatorAscencore
21 hours agoCrypto Institutional Lending: $SYRUP vs $CPOOL vs $GFI – Which Will Win? [ Crypto Lending Week ]Crypto for the Rest of Us
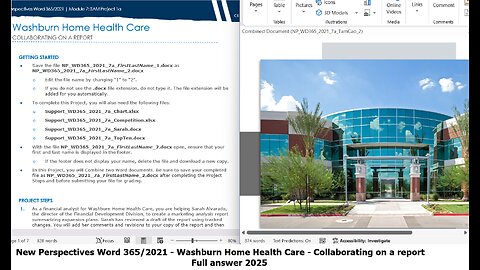
2 days agoNew Perspectives Word 365/2021 | Module 7: SAM Project 1a | Washburn Home Health Care (Answer 2025)saxi753
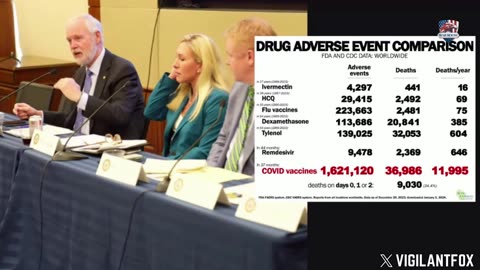
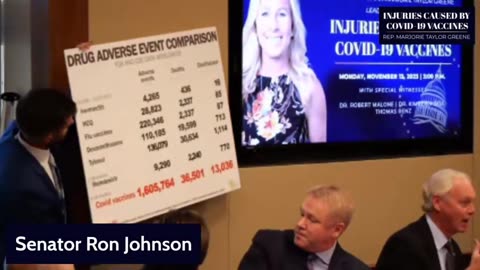
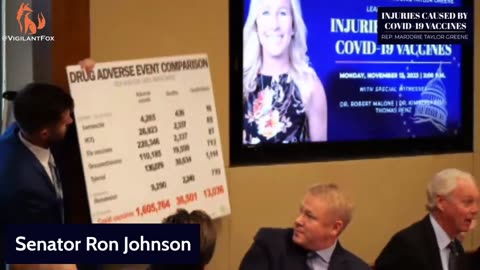
1 year agoSen. Ron Johnson Shares the Most Censored Chart in Congressional HistoryVigilant FoxVerified
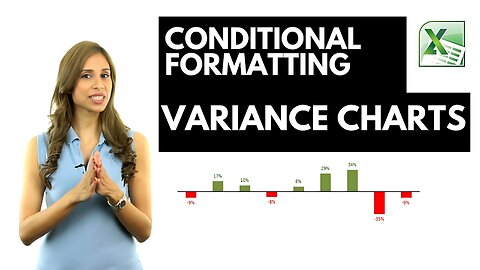
2 years agoExcel Advanced Charts: Comparison to Budget, Previous Year and Forecast or OutlookLeila Gharani
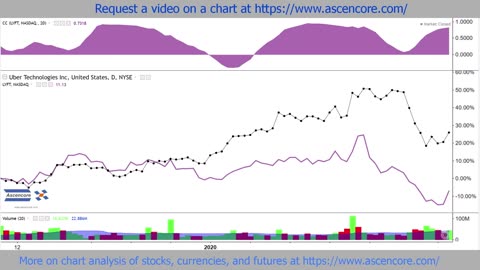
1 year ago(UBER) vs (LYFT) Stock Chart Comparison With The Correlation Coefficient IndicatorAscencore
1 year agoSen. Ron Johnson Shares the Most Censored Chart in Congressional HistorySarah Snyder Trusts The PlanVerified
2 years agoRon DeSantis vs. Donald Trump: A human design chart comparison challenge!humandesignadvantage
2 years agoThe Curious Case of Jordan Peterson's Guests | MEDIA REPRESENTATION WEEK PART 2Leather Apron Club


![Trading Platform Comparison: Charting Software Edition | TradingView vs. WeBull vs. eSignal [2023]](https://1a-1791.com/video/s8/1/d/W/c/u/dWcul.oq1b.2-small-Trading-Platform-Comparison.jpg)
![Crypto Institutional Lending: $SYRUP vs $CPOOL vs $GFI – Which Will Win? [ Crypto Lending Week ]](https://1a-1791.com/video/fww1/82/s8/1/O/9/v/c/O9vcz.oq1b.2-small-Crypto-Institutional-Lendin.jpg)