1 year agoThe Fatal Conceit: The Errors of Socialism with Aneesh Karve (WiM520)"What Is Money?" ShowVerified
10 months agoNewsGPT - 24/7 News from around the world powered by AINewsGPT | The world’s first 24-hour news channel powered entirely by AI.
1 year agoDigital Exorcist Case File 1: DEFRAG - Official Trailer | Latin American Games ShowcaseBlack Box Game TrailersVerified
1 year agoHero Whistleblower Barry Young - Had Access To Raw Health Data And Faces TrialFanaticVoyageVerified
1 year agoTHE VENOM INDUSTRIAL COMPLEX "REVEALING THE WORLD OF VENOM BASED PHARMA PRODUCTS" DR. 'BRYAN ARDIS'AndreCorbeil
9 months agoBLACKHAWK MID-AIR Collision AA5342 KS to DCA- Monkey Werx 1 30 2025JUAN O SAVIN PRESENTATIONSVerified
2 years agoBNN (Brandenburg News Network) 11/9/2023 Mark Finchem and Seth Keshel, Ralph and KarenBNN (Brandenburg News Network)Verified
9 months agoSupreme Court Cases and Fun & Educational Adventures with Albert's ExpeditionsBEK TVVerified
2 months agoShelly Cashman Excel 2019 | Modules 4-7: SAM Capstone Project 1a Victoria Streaming Servicesaxi753
5 years agoA* Pathfinding Visualization Tutorial - Python A* Path Finding TutorialTech With TimVerified
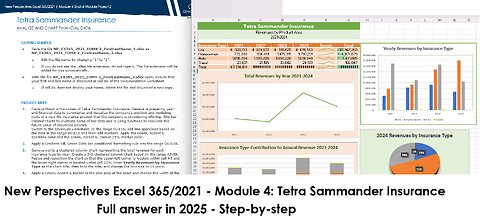
3 months agoNew Perspectives Excel 365/2021 | Module 4: End of Module Project 2 | Tetra Sammander Insurance 2025saxi753
7 months ago"WH Security Breach EXPOSED: How Biden's Team Put America at Risk! 🇺🇸🔐 #SecurityFail"BREAKING NEWS FROM WHITE HOUSE
1 month agoCOVID Vaccine Hydrogels Nano Tech Programmable Human Interface ~ By Reese Report (2024)Truths UnlimitedVerified
2 years agoHurricane Hilary: Unleashing Destruction and the Future Outlook - Live on the Off Topic ShowVideomattpresents_
1 year agoThe BEST Way to Save in Bitcoin - Wicked Smart Bitcoin (THE Bitcoin Podcast)THE Bitcoin Podcast with Walker AmericaVerified