7 months agoDJIA Expected Price Range for November 6, 2023Stonksmaster. Master of Stonks. Slayer of Numbers.
3 years agoSP500 All Time Highs...Again (How High Can We Go?) | S&P 500 Technical AnalysisFiguring Out Money
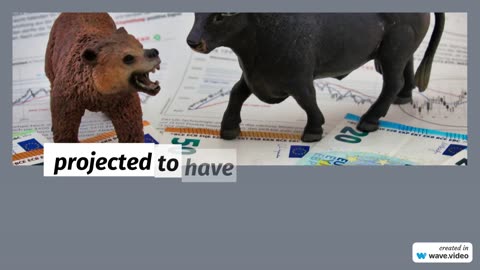
4 years agoSP500 Momentum Fading (Bulls Vs. Bears Ultimate Test Coming) | S&P 500 Technical Analysis UpdateFiguring Out Money
8 months agoDJIA Expected Price Range for 10-13-2023Stonksmaster. Master of Stonks. Slayer of Numbers.
15 days agoGAMESTOP Roaring KITTY - BUY & SELL ZONES! How to MAKE MONEY - Technical CHART AnalysisMartyn Lucas InvestorVerified
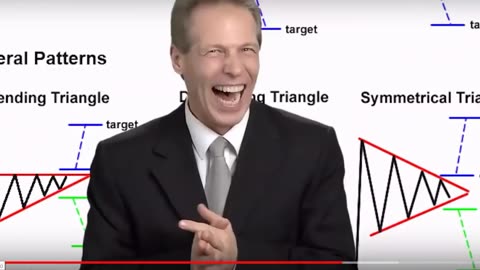
6 months agoTechnical Analysis Chart Patterns or is it Roulette THE TRUTH EXPOSED! (REDUX FROM 2019)ORACLEFASTMONEYTRADER
2 months agoTLRY Stock TILRAY Technical Chart Analysis - Martyn Lucas InvestorMartyn Lucas InvestorVerified
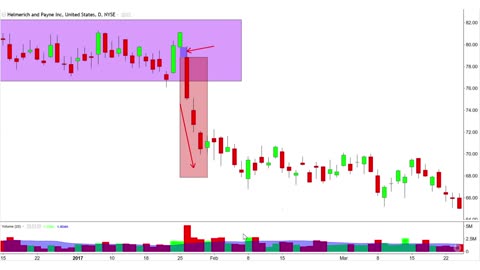
6 months agoHighly Bullish & Bearish (Candlestick Charting Patterns): Example Case Study HP Stock ChartAscencore
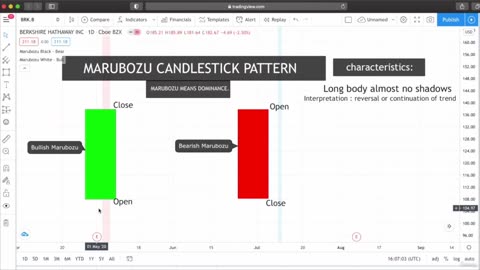
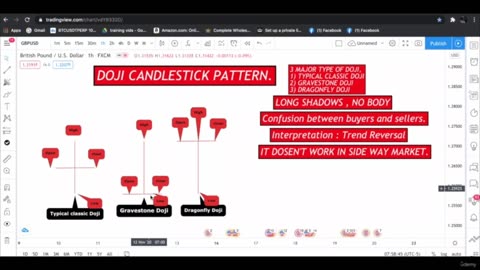
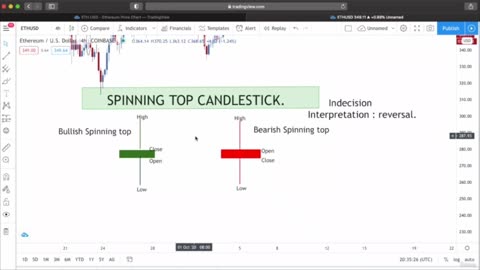
9 months agoCandlestick Patterns with live chart examples- Spinning top candlestick patternCRYPTOUSTAD