3 years agoExample of Looking at Stock Charts, Puts & Calls, Options Trading: Advanced Micro Devices AMD [ASMR]chycho
3 years agoLearn the Best Trading Methods to Use in 2018 - History Repeats on Stock ChartsDayTradeToWin
3 days agoStock Market Analysis with Phil Grande of Phil's Gang Radio Show 03/24/2025The Phil's Gang Radio Show ChannelVerified
1 month agoNVIDIA stock price live, FOREX, EUR USD, GBP USD, JPY USD, CAD USD, AUD USD, NVIDIA share price liveStock Market Live Charts
8 months agoTrump's Stock PUMPS, Breaking Market News & The Week Ahead || The MK ShowMatt KohrsVerified
6 months agoSCRIPTURES AND WALLSTREET - RIGGED STOCK MARKET AND UP COMING CRASHStew Peters NetworkVerified
1 month ago$1 Trillion Stock Market Wipeout Has Investors Rethinking Diversification | The Gold SpotScottsdale Bullion & Coin
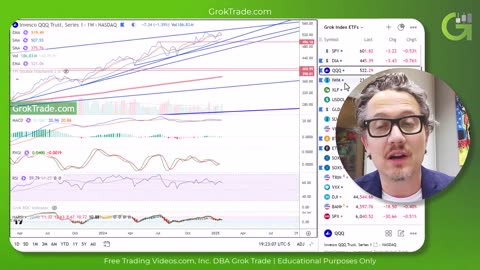
9 months agoBig Market Shifts! 📉📈 June 29, 2024 - Stock Market Analysis & Trading InsightsMichael Lamothe
1 month agoNVIDIA stock price live, FOREX, EUR USD, GBP USD, JPY USD, CAD USD, AUD USD, NVIDIA share price liveStock Market Live Charts

![Example of Looking at Stock Charts, Puts & Calls, Options Trading: Advanced Micro Devices AMD [ASMR]](https://1a-1791.com/video/s8/1/n/k/p/5/nkp5c.oq1b.2-small-Example-of-Looking-at-Stock.jpg)