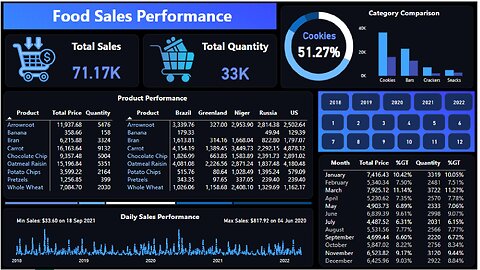
7 months agoTransform Your Data with Powerful Power BI Dashboards! - Food Sales Dashboard Blue and BlackTrend Clips Hub
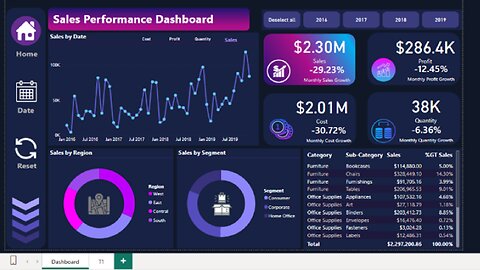
7 months agoTransform Your Data with Powerful Power BI Dashboards! - Sales Performance Dashboard Dark ThemeTrend Clips Hub
3 years agoTop STEEL Exporters | World's Largest Steel Producing Countries | 1968 -2021 ⛓️📊Data Ninja
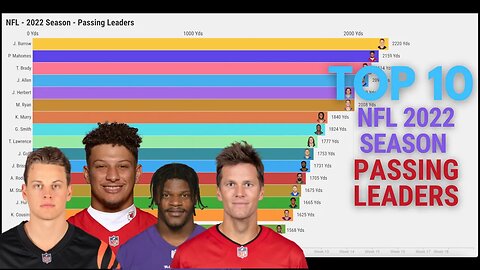
1 year agoTop 10 - 2022 NFL Passing Leaders - A Race to the Top! | Data VisualizationNumerical Narratives
2 years agoEXCEL TUTORIAL: MASTERING THE IF FUNCTION FOR DATA ANALYSIS - HOW TO SET MULTIPLE CONDITIONSExcel Plus
2 years agoWhat is Tableau introduction? | Creating Visualizations in Tableau | Basic Calculations in Tableauinfosectrain01
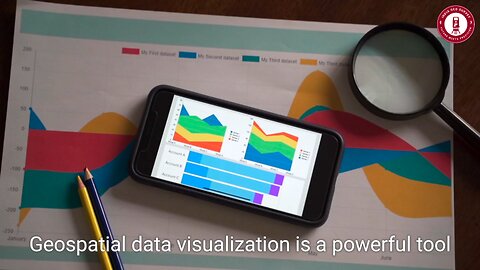
3 months ago🌍 Geospatial Data Visualization – Transform Data into Powerful Insights! 📊🗺️indiageosurvey
3 months agoSAAS Video Editing & Animation for Fivetran & Google Cloud | After Effects Motion GraphicsMadMindPro
1 year agoInfographic design, piktochart, design info graphics, design an infographic, good infographicSOLUTIONLAB
3 months agoStudent Work(Project )| DFP40203 Project: Real Estate System Development Using Python Work VideoAssignment Helper
3 months agoStudent Work(Project)|ENGR7019 MATLAB Project(Assessments 1 & 3)Work Video|Western Sydney UniversityAssignment Helper For Students