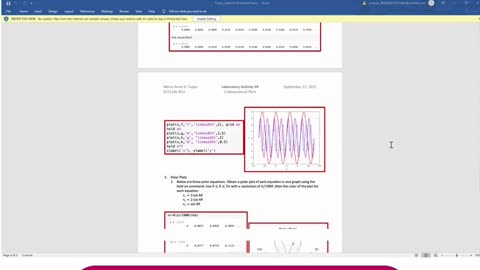
4 months agoStudent Work(Project)|ECE120L Project :Graphing, Equations, and Engineering with MATLAB Video |UofTAssignment Helper For Students
2 years agoUnknown Facts About Understanding The Different Types of Cryptocurrency - SoFiCrypto Sweet Spot
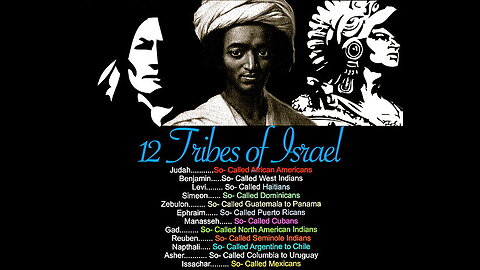
2 years agoEPHRAIM & MANNASSEH ARE NOT A PART OF THE 12 TRIBES????…THOSE VOID OF UNDERSTANDING & SCOFFERS DONT ACCEPT THE NEW TESTAMENT. THIS IS WHAT MAKES THE TRUTH PRECIOUS, YOU HAVE TO HAVE STUMBLING BLOCKS!!🕎Ezekiel 37;16-20 then take another stick,RoyaltyLordPrinceShamiyah144