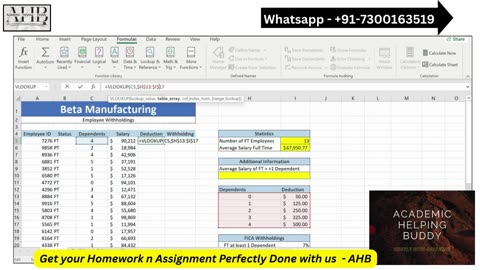
13 days agoExp22_Excel_AppCapstone_CompAssessment_Manufacturing | Pearson Assignment | Beta ManufacturingAcademic_Helping_Buddy
3 months agoAdvanced Excel for Data Analysis (A Data Analyst’s Best Friend)SkillWarp: Upskill for the Future | AI, Business, Cybersecurity & More
7 years agoBest UFO Footage I've Ever Seen in High Definition & Fermi Paradox Solved?Leak ProjectVerified
6 months agoMastering Pivot Tables in Excel: A Beginner’s GuideLearn & Grow: tutorial with Microsoft Tools for Everyone, coding, any others subjuctes
6 months agoMastering Excel Charts | A Beginner's Guide to Stunning VisualsLearn & Grow: tutorial with Microsoft Tools for Everyone, coding, any others subjuctes
4 years agoLost in the Lost Dutchman State Mine & Superstition Mountains, with Gail Rainbow Food RocksLeak ProjectVerified
5 months agoMastering Excel Formatting: Unlock Professional-Looking Spreadsheets!Learn & Grow: tutorial with Microsoft Tools for Everyone, coding, any others subjuctes
7 years agoHans Wilhelm - Reincarnation, Why are We Here? Spirit Possession & ReincarnationLeak ProjectVerified


![[2024] How to Add Progress Bars in Excel](https://1a-1791.com/video/s8/1/j/P/F/y/jPFyu.oq1b.2-small-2024-How-to-Add-Progress-Ba.jpg)