2 years agoThe Vaccines Saved 20 Million Lives? Anyone With Half a Brain Can Tell You the Graph Says OtherwiseVigilant FoxVerified
5 months agoGraphing Piecewise Functions, Domain & Range - Limits, Continuity, & Absolute Value ,TheOrganicChemistryTutor
2 years agoThe Vaccines Saved 20 Million Lives? Anyone With Half a Brain Can Tell You the Graph Says OtherwiseRVM NewsVerified
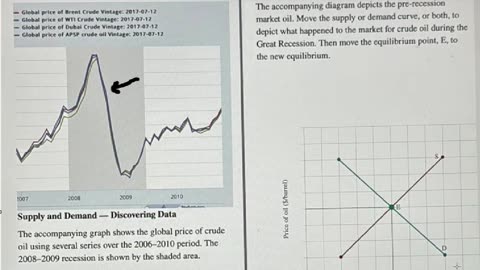
3 months agoMicroeconomics Help: The accompanying graph shows the global price of crude oil using several seriessaxi753
1 year agoNEW 06 19 2023 THE EVENT. - EARTH ALLIANCE SPACE WEATHER INTEL - ENERGETIC VIBRATIONAL ANOMALYThe Galactic Federation Of Light
3 years agoThis CDC graph shows it was WRONG to fire people with Natural COVID immunity last yearDrSuneelDhandVerified
3 years agoVACCINE HOLOCAUST [If they used the real figures, the graph PEAKS might be 10times higher]Op Freedom
1 year agoHow To Graph Equations - Linear, Quadratic, Cubic, Radical, & Rational FunctionsTheOrganicChemistryTutor


![VACCINE HOLOCAUST [If they used the real figures, the graph PEAKS might be 10times higher]](https://1a-1791.com/video/s8/6/W/W/O/O/WWOOc.oq1b.1.jpg)