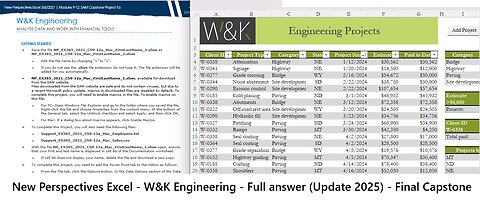
4 months agoNew Perspectives Excel 365/2021 | Modules 9-12: SAM Capstone Project 1a | W&K Engineeringsaxi753
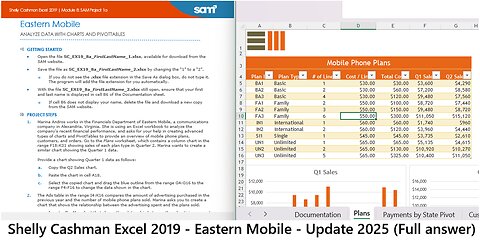
4 months agoShelly Cashman Excel 2019 | Module 8: SAM Project 1a | Eastern Mobile (Update 2025)saxi753
1 year ago'Moderna' vs. 'Pfizer' Death Toll & Injury Comparisons With Dr. 'John Campbell'AndreCorbeil
2 years ago33 Evergrandes? Making sense of China’s economic data and real estate bubbleLei's Real Talk
2 years agoGamma Brainwaves the key to Teleportation, fly-by-thought tech & Space Ark activationExopolitics Today with Dr. Michael SallaVerified
1 year agoVAERS coverup of COVID19 bioweapon mortality - Conversation with Albert BenavidesHumanity Is Under Attack
5 months agoThe Best Crypto Trading Strategies for 2025 (Top 5 Tactics to Master the Market)decentralisednews
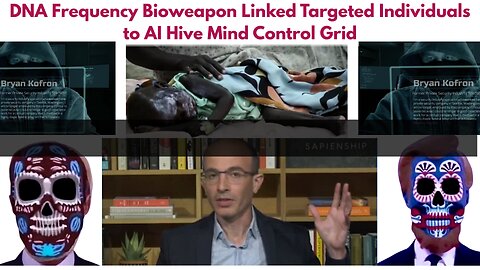
8 months agoDNA Frequency Bioweapon Linked Targeted Individuals to AI Hive Mind Control GridFanaticVoyageVerified
1 year agoNewsGPT - The Unhuman Truth. 24/7 News from around the world powered by AINewsGPT | The world’s first 24-hour news channel powered entirely by AI.
8 months agoHow to Install Tableau and Create First Visualization | Tableau Tutorials for Beginners6rumble6