1 year agoCharting & Scalping Tactics - Using EWO Strategies & Stops In The Stock MarketAmerican Dream Trading
1 year agoCharting Key Levels - Training Critical Areas & Levels In The Stock MarketAmerican Dream Trading
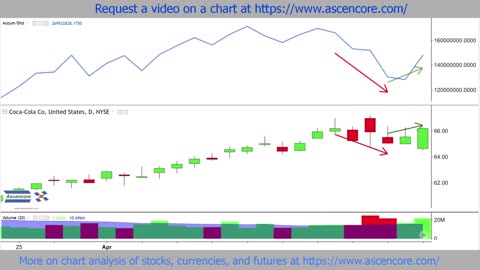
1 year agoExplaining The Accumulation Distribution AD Indicator An Analysis Of Coca-Cola Stock ChartAscencore
2 years ago#btc #eth #doge #crypto #cryptocurrency #Trendingshorts #trading #trades #charting #chartsMOASS STOCKS & CRYPTO LIVE
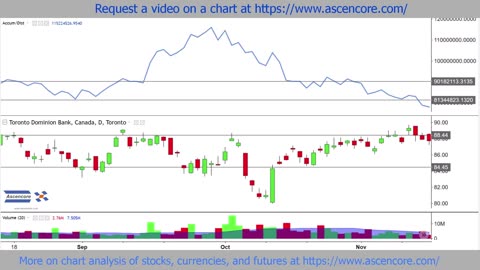
1 year agoToronto Dominion Bank (TD) Stock Chart Analysis With The Accumulation Distribution AD IndicatorAscencore
1 year agoMaster Class - Charting Trendlines and Training Entry Zones In The Stock MarketAmerican Dream Trading
2 years agoMastering the Art of Scalping, Analyzing Movement with Charting Techniques Stock Market TrainingAmerican Dream Trading
1 year agoSetting Profitable Stops - Using Charting Key Level & Modifying Pro Stops In The Stock MarketAmerican Dream Trading
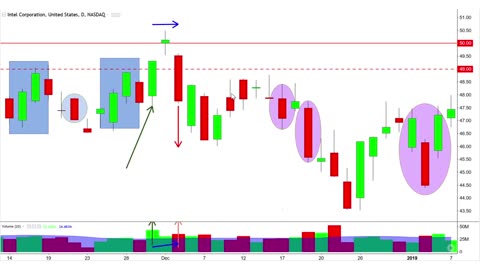
1 year agoSpinning Top Candlestick Charting Pattern Analysis Example Case Study With (INTC Stock Chart)Ascencore
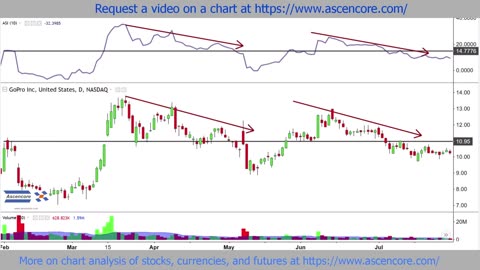
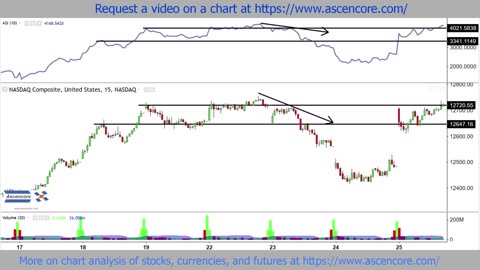
1 year agoNASDAQ Composite Stock Chart Accumulation Swing Index (ASI) Indicator Analysis ExampleAscencore
 3 watching3 watching