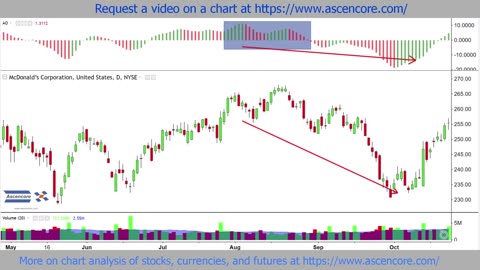
1 year agoMcDonald’s (MCD) Stock Chart Analysis With The Awesome Oscillator Twin Peaks SetupAscencore
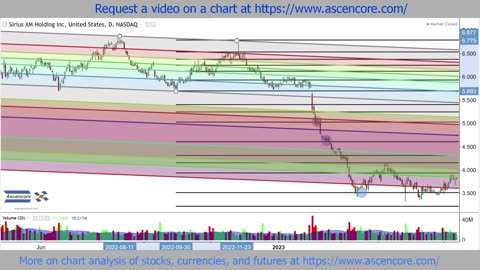
1 year agoFibonacci Channels Combined With Retracements For Time Analysis SIRI Stock Chart ExampleAscencore
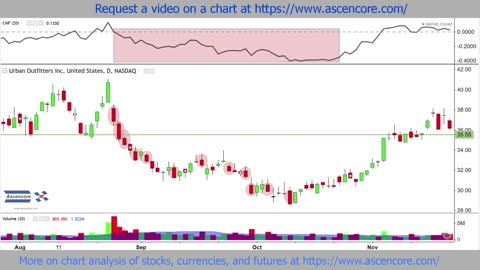
1 year agoUrban Outfitters (URBN) Stock Chart Analysis With The Chaikin Money Flow IndicatorAscencore
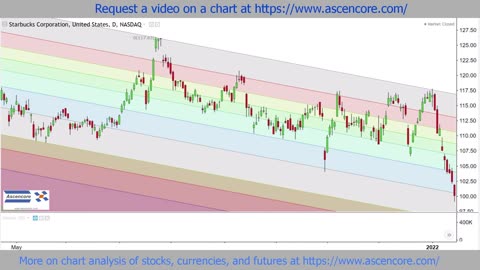
1 year agoStarbucks (SBUX) Stock Chart Analysis Projected & Extended Fibonacci Channel LevelsAscencore
3 years agoEp. 138 Crypto Hits New Highs & Stocks Take A Breather || Dumb Money w/ MattMatt KohrsVerified
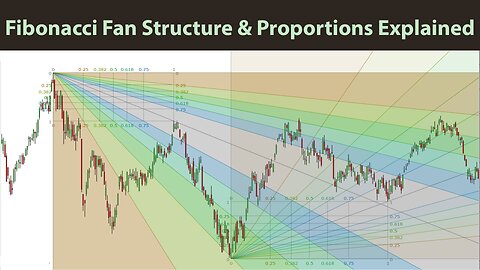
1 year agoFibonacci Speed Resistance Fans Proportions Explained With SNOWflake Stock Chart ExampleAscencore
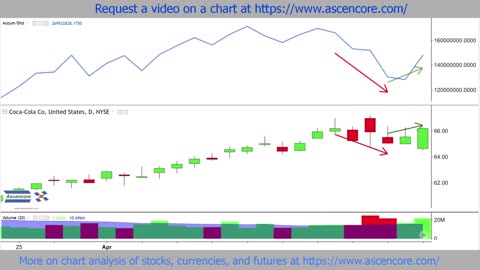
1 year agoExplaining The Accumulation Distribution AD Indicator An Analysis Of Coca-Cola Stock ChartAscencore
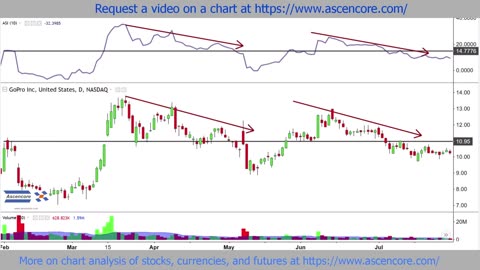
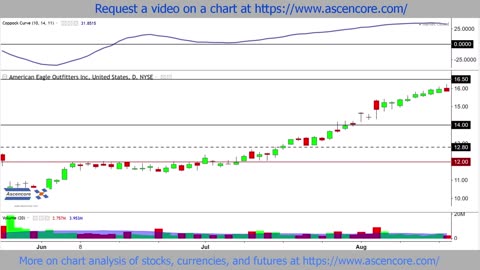
1 year agoAmerican Eagle Outfitters (AEO) Stock Chart Analysis With The Coppock Curve IndicatorAscencore