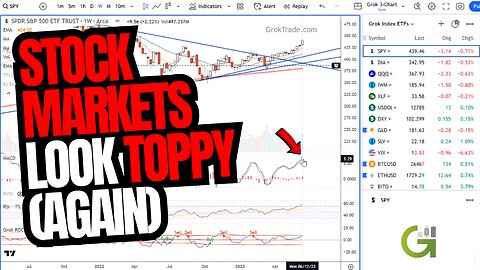
1 year agoStock Markets Look Toppy (AGAIN) - Stock Market Technical Analysis 6/18/23Grok TradeVerified
1 year agoBitcoin News | Bitcoin Price Plunges Again And Now Vulnerable To More Losses | More Losses In BTC? |Crypto Mash
2 years ago$TBLT $TBLTW PSYCOLOGICAL LEVELS .50 AND $1IN NO RISH TO SELL SI 200% THIS IS MADNESS THIS IS SPARTAFreeFromItAll
8 months agoLAZR's Bullish Turnaround? Deep Dive into Luminar Technologies' Market Surge #shorts #tradingQuant Sync
4 years agoUltimate Buy Sell Secret Forex Indicator - Buy / Sell Signal For Forex TradingBigRobTheDreamMaker
1 year agoPolkadot (DOT) News Today | Analyzing DOT's $5.23 Level | Is DOT Ready for a Breakout? | DOT Price |Crypto Mash
10 months agoPolkadot (DOT) Fails to Keep Pace with Broader Altcoin Rally | Polkadot (DOT) Price Fails to Fire UpCrypto Mash
3 years agoProven Best Forex Indicators - Proven Best Forex Strategy 2021 | Forex StrategyBigRobTheDreamMaker
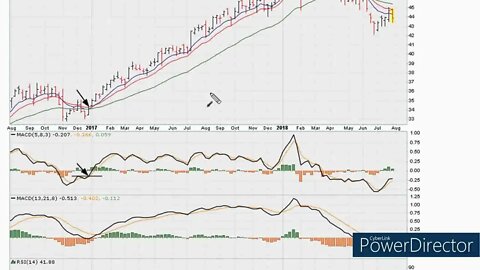
2 years agoHow To Use The MACD Histogram - How To Use The MACD Histogram MACD Video4BigRobTheDreamMaker
2 years agoHow To Set Up MACD Histogram - MACD Histogram - Technical Analysis BasicsBigRobTheDreamMaker