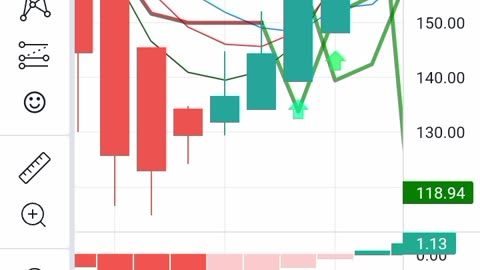
1 year agoTesla scenario’s #tsla_stock_analysis #daytrading #shortsUnleash your inner trader with Team NakedTrader!
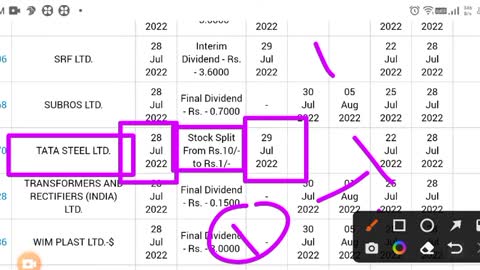
1 year agoTATA STEEL Share News Today - TATA STEEL Stock Latest News - TATA STEEL Stock Analysis - #tatasteelHessongHedberg
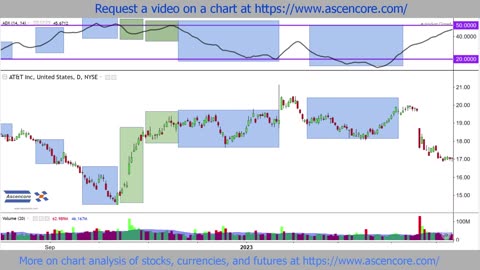
6 months agoIBM Stock Chart Analysis Example Case Study 4 Stable & Unstable Short Term Movement IdentificationAscencore
6 months agoIntel (INTC) Stock Chart Analysis Using The Arnaud Legoux Moving Average (ALMA) IndicatorAscencore
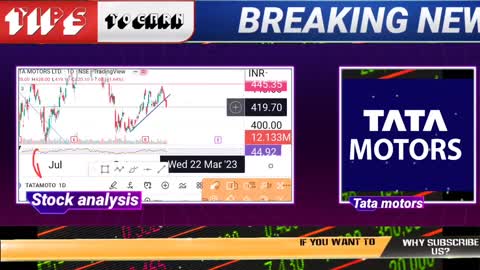
1 year agotata motors share news today in hindi _ tata motors stock latest news tomorrow stock analysis todayvanitaalmanza2977pro
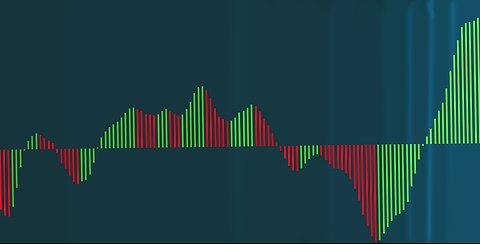
6 months agoNetflix (NFLX) Stock Chart Analysis With The Awesome Oscillator Twin Peaks SetupAscencore
6 months ago$EPD Stock Fundamental Analysis 2023 | Enterprise Product Partners LPStock Market Gematria Investing
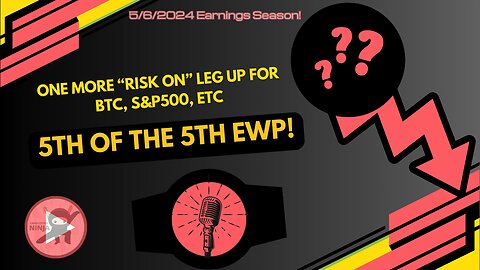
1 month ago📉 S&P500 Hip Hop Ninja Analysis - May 6th, 2024 - 5th of the 5th EWP Highest TimeframeCandlestick Ninja TV
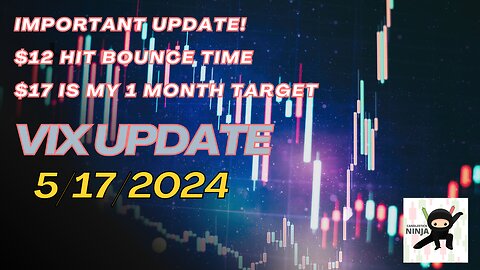
1 month ago🚀 VIX $12 Target Hit: Candlestick Ninja’s Post-Market Analysis & Predictions 5/17/2024Candlestick Ninja TV
1 year agoBlackRock analysis- #blackrock #stocktrading #shortsUnleash your inner trader with Team NakedTrader!