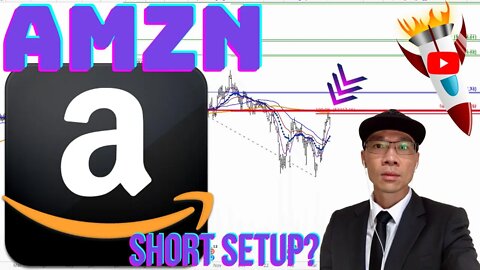
2 years agoAmazon.com - $AMZN Stock Chart Analysis. Look for Follow Through. If No Trigger, DO NOT SHORT. 📉📉Centered Trading
7 months agoDJIA Expected Price Range for November 6, 2023Stonksmaster. Master of Stonks. Slayer of Numbers.
8 months agoDJIA Expected Price Range for 10-13-2023Stonksmaster. Master of Stonks. Slayer of Numbers.
14 days agoGAMESTOP Roaring KITTY - BUY & SELL ZONES! How to MAKE MONEY - Technical CHART AnalysisMartyn Lucas InvestorVerified
2 months agoTLRY Stock TILRAY Technical Chart Analysis - Martyn Lucas InvestorMartyn Lucas InvestorVerified
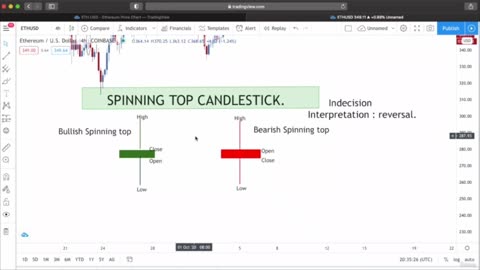
9 months agoCandlestick Patterns with live chart examples- Spinning top candlestick patternCRYPTOUSTAD
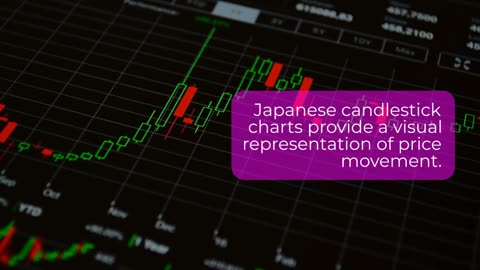
1 year agoThe Complete Beginner's Guide to Trading - 5 of 10: Understanding Technical AnalysisTechCash: Your Guide to the Latest Fintech Trends and Digital Money Solutions
7 months agoDJIA Expected Price Range for November 14, 2023Stonksmaster. Master of Stonks. Slayer of Numbers.