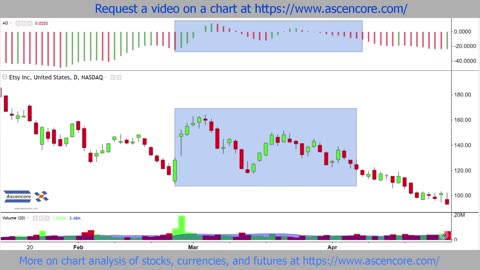
8 months ago🎯📈 Dark Cloud #indicator – Piercing Line Reversal chart Pattern in #tradingview [TradingFinder] 🚀📊tradingfinder
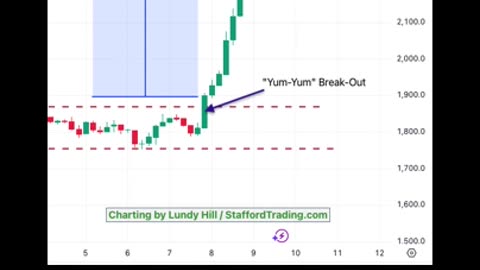
2 years agoStong breakouts chart patterns|price action|tecnical anayalsis|trendline|national forex academySadarkhan
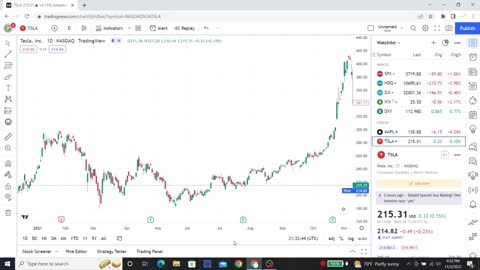
2 years agocandle stick/bar chart setting[forex Trading]Technical Aalysis[Deriv Trading] Price Action Part 4Sadarkhan
1 year ago$USDT.D / USDT Dominance - 1H Update In my analysis of the USDT.D chart, it appears promisingStormTrading
2 years agoChart PAtterns are Not Always CLEAN ChartPatterns Candlestick Stock Market Forex|national forex acdeSadarkhan
2 years agoHow To Draw Trend Lines On A Chart Explained Simply (forex, stocks, crypto)PersistentTradingGroup
2 years agoSomebody's Baby - Jackson Browne (cover-live by Bill Sharkey)Bill Sharkey: Live Cover Songs

![🎯📈 Dark Cloud #indicator – Piercing Line Reversal chart Pattern in #tradingview [TradingFinder] 🚀📊](https://1a-1791.com/video/s8/1/L/o/-/a/Lo-au.oq1b.2-small--Dark-Cloud-indicator-Pierc.jpg)


![candle stick/bar chart setting[forex Trading]Technical Aalysis[Deriv Trading] Price Action Part 4](https://1a-1791.com/video/s8/1/v/F/Y/y/vFYyg.oq1b.2-small-candle-stickbar-chart-setti.jpg)