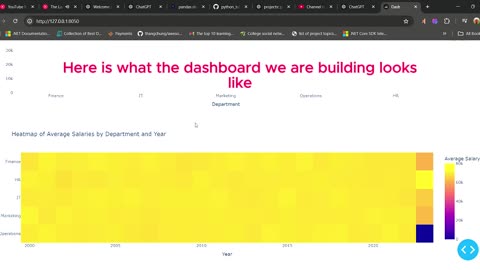
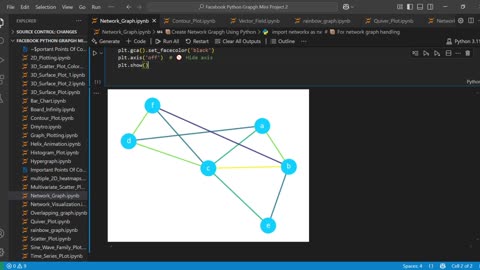
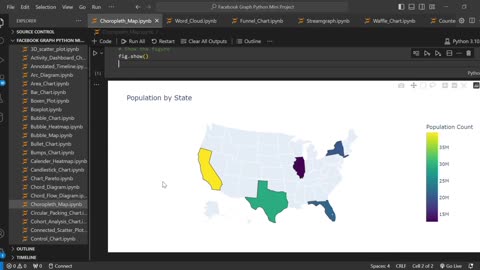
8 months agoProject Title: Interactive Data Dashboard and Custom Analytics with Pandas and Plotly | #003damilolaadegunwa
1 month agoStudent Work (Project) | CST8333 Project 4 - Programming Language Feature Add-on | Algonquin CollegeProgramming Assignment Helper For Students | Agencies | Companies
5 months agoStudent Work (Assignment)|COMP3013 3D Animation | C++ & OpenGL Real-Time Rendering| UoMAssignment Helper
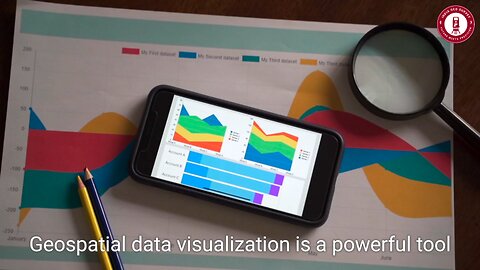
6 months ago🌍 Geospatial Data Visualization – Transform Data into Powerful Insights! 📊🗺️indiageosurvey
6 months agoStudent Work(Project)|ENGR7019 MATLAB Project(Assessments 1 & 3)Work Video|Western Sydney UniversityAssignment Helper For Students
1 year agoInfographics and data visualizations are effective ways to present complex informationSubraa
1 year agoInvesting in high-quality imagery is the cornerstone of creating engaging visual contentSubraa