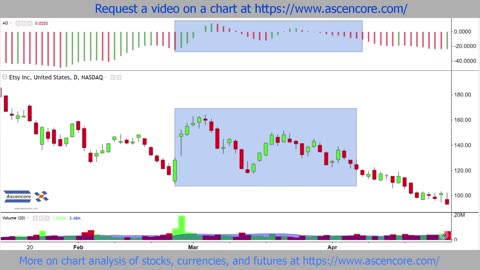
1. Bullish & Bearish Candlestick Charting Patterns With Combined Candles: Example DJI DOW Index ETF

    Bullish & Bearish Candlestick Charting Patterns With Combined Candles: Example DJI DOW Index ETF

    11
  2. VIX Update: Bearish Harami Formations Signal Potential Drop - 4/18/2024

    VIX Update: Bearish Harami Formations Signal Potential Drop - 4/18/2024

    12
  3. Bitcoin Breaks through RESISTANCE but Bearish Divergence still in play

    Bitcoin Breaks through RESISTANCE but Bearish Divergence still in play

    25
    1
  4. BITCOIN reaches NEW HIGHS BUT WATCH Bearish Divergence

    BITCOIN reaches NEW HIGHS BUT WATCH Bearish Divergence

    3
    0
    41
    1
  5. Bullish Momentum Building in Pfizer (PFE): Targeting $30.50 - $31 - Then very Bearish from here!

    Bullish Momentum Building in Pfizer (PFE): Targeting $30.50 - $31 - Then very Bearish from here!

    15
  6. AUDUSD still BEARISH outlook reaching KEY SUPPORT levels

    AUDUSD still BEARISH outlook reaching KEY SUPPORT levels

    30
  7. Best Simple Candlestick Pattern for Any Market (Forex, Stocks, or Crypto) 📊🔥

    Best Simple Candlestick Pattern for Any Market (Forex, Stocks, or Crypto) 📊🔥

    5
  8. US Slaps 104% Tariff on China: Market Plummets!

    US Slaps 104% Tariff on China: Market Plummets!

    11
    1
  9. Bearish Stock Chart Example ETSY Awesome Oscillator Negative Zero Line Cross

    Bearish Stock Chart Example ETSY Awesome Oscillator Negative Zero Line Cross

    19
  10. Bitcoin reaches NEW Highs but Bearish Divergence still in play

    Bitcoin reaches NEW Highs but Bearish Divergence still in play

    32
    1
  11. "Market Echoes 2001 Crash as Gold and Credit Flash Red | Larry McDonald"

    "Market Echoes 2001 Crash as Gold and Credit Flash Red | Larry McDonald"

    471
  12. Thoughts on Wall Street: The Stock Market is Extremely Overvalued, Major Bubble Ready to Pop

    Thoughts on Wall Street: The Stock Market is Extremely Overvalued, Major Bubble Ready to Pop

    2
    0
    16
  13. XOM Stock Chart Bearish Reversal Potential Analysis With The Aroon Indicator

    XOM Stock Chart Bearish Reversal Potential Analysis With The Aroon Indicator

    17
  14. Bearish Stock Chart Analysis With The Balance Of Power Indicator (CHWY) Example

    Bearish Stock Chart Analysis With The Balance Of Power Indicator (CHWY) Example

    16
    1
  15. ICT Trading Strategy | Backtest Day 7 +$1,835

    ICT Trading Strategy | Backtest Day 7 +$1,835

    13
  16. ICT Concepts | Backtesting the 5m Unicorn Model | Day 3: +$1310 PROFIT

    ICT Concepts | Backtesting the 5m Unicorn Model | Day 3: +$1310 PROFIT

    12