1 month agoHow to Make a 📅 Calendar Heatmap 🌡️ Using Python 🐍 & Matplotlib 📊AI Evolutionary Technology
10 months agoHow to change default filename from Matplotlib NavigationToolbar in a PyQt5 applicationTechSphere
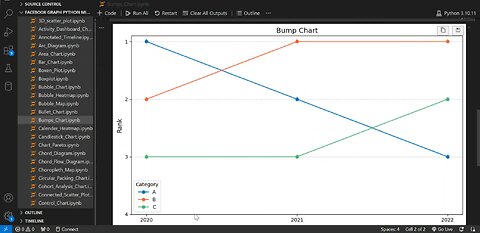
1 month agoHow to Create a Bump Chart in Python 🐍 with Matplotlib 📊 & Pandas 🐼AI Evolutionary Technology