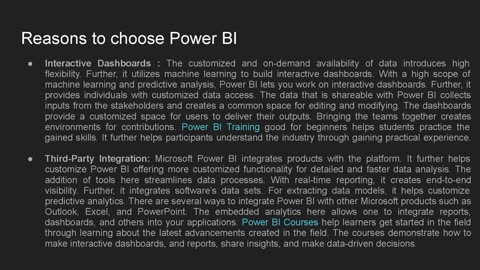
11 months agoThe Power of Data Visualization: Unlock the Secrets of Microsoft Power BI With A Free Coursedollarland
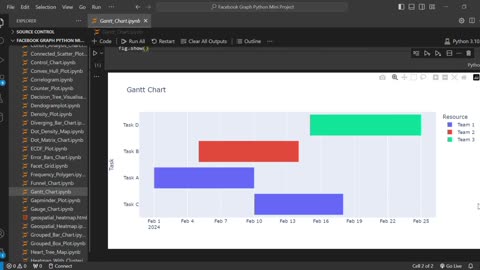
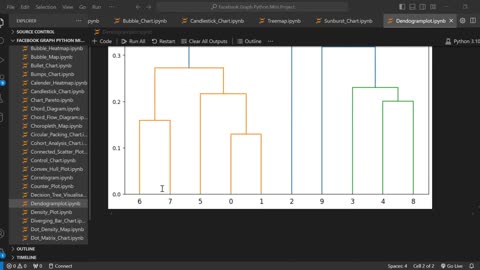
1 month agoCreate Stunning Gantt Charts in Python using Plotly | Project Timeline VisualizationAI Evolutionary Technology
20 days agoStudent Work (Assignment) | COMP2221 System Programming Langton’s Ant C Project | Durham UniversityAssignment Helper
9 months agoFeel and Manipulate the Energy in The Field | ROCKET LEAGUE ⚽️🏎️ ~ ᵍᵃᵐᵉ@ʷᵃʳᵉ 🥷⚔️𝙶𝚊𝚖𝚎Δ𝚠𝚊𝚛𝚎 🥷⚔
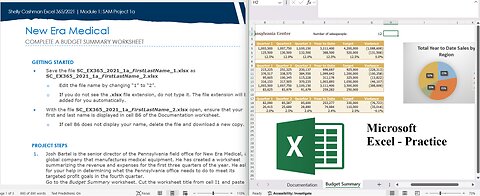
6 months agoSAM Project 1a Excel Module 01 Creating a Worksheet and a Chart - New Era Medical COMPLETE A BUDGETsaxi753
6 months agoRobotic Endoscopy Devices Share to Witness Significant Revenue Growth during the Forecast Periodsakshi25
4 months agoCreating Insightful Dashboards: Redmine Plugins for Project Management Data Visualizationemilyjones29