4 months agoFFIE Stock - FSRN Stock BITCOIN ALL TIME HIGH Chart Analysis! SENSEI CRYPTO - Martyn Lucas InvestorMartyn Lucas InvestorVerified
1 month agoNVDA Stock NVIDIA to $200 - Chart Analysis LIVE! Martyn Lucas InvestorMartyn Lucas InvestorVerified
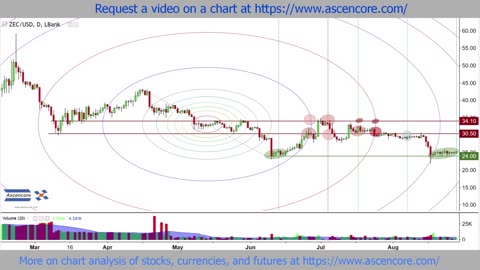
8 months agoStock Chart Time Analysis With Fibonacci Arcs (PZZA (Papa Johns Stock Chart Example))Ascencore
1 month agoGold's 'Third Wave' Bull Run: Gary Wagner Reveals Key Chart Signals for a Major BreakoutKitco NEWSVerified
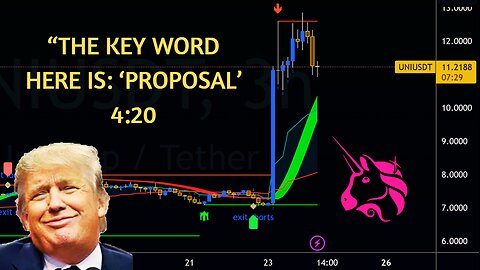
7 months agoUNISWAP Rug Pull Soon?! Weekend Crypto Chart Analysis Bitcoin Ethereum Solana Kaspa Price PredictionAlgo Factory
5 months agoSPCE Stock VIRGIN GALACTIC CHART Technical Analysis Review Martyn LucasMartyn Lucas InvestorVerified
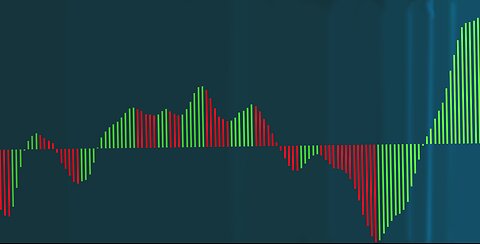
9 months agoNetflix (NFLX) Stock Chart Analysis With The Awesome Oscillator Twin Peaks SetupAscencore
9 months agoIBM Stock Chart Analysis Example Case Study 4 Stable & Unstable Short Term Movement IdentificationAscencore
6 months agoBITCOIN ALL TIME HIGH - FSR - SOUN & SPCE Chart Analysis! SENSEI CRYPTO - Martyn Lucas InvestorMartyn Lucas InvestorVerified
9 days agoDon't BUY Anything Until You Watch This Video! || I Show You the One Chart You Need to WatchHack Your Finances
4 months agoSOUN Stock - SoundHound AI CHART Technical Analysis Review - Martyn Lucas InvestorMartyn Lucas InvestorVerified
1 month agoNVDA Stock NVIDIA to $200 - CHART ANALYSIS! Martyn Lucas InvestorMartyn Lucas InvestorVerified
3 months agoASTI Stock - Ascent Solar Technologies - Chart Technical Analysis - Martyn Lucas InvestorMartyn Lucas InvestorVerified
6 months agoSPCE Stock VIRGIN GALACTIC CHART Technical Analysis Review Martyn Lucas InvestorMartyn Lucas InvestorVerified