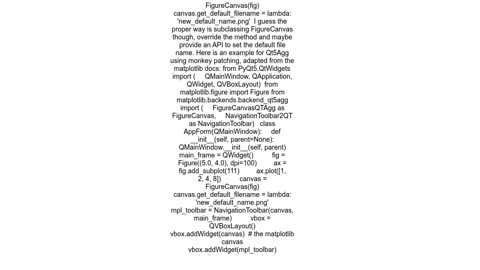
10 months agoHow to change default filename from Matplotlib NavigationToolbar in a PyQt5 applicationTechSphere
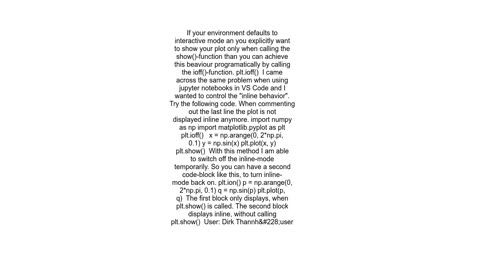
6 months agoMatplotlib plot not showing with plt.ion() in a python script, but working in python shellTechSphere
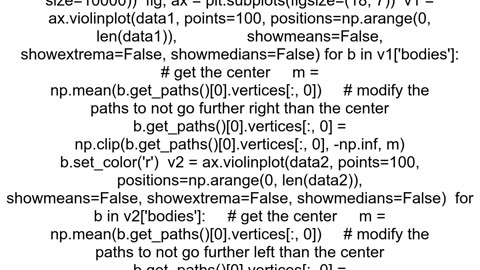
6 months agomatplotlib share x axis but don't show x axis tick labels for both, just oneTechSphere
8 months ago8. [Hands-on] Predict Results | Skyhighes | Data Science & Machine Learning in PythonSkyhighes Education
8 months ago4. Google Colab Setup | Skyhighes | Data Science & Machine Learning in PythonSkyhighes Education
8 months ago9. [Hands-on] Visualize Results | Skyhighes | Data Science & Machine Learning in PythonSkyhighes Education
8 months agoMaster Supervised Learning Algorithms: Linear Regression, Decision Trees, & SVM Explained!Ikramullah9054


![8. [Hands-on] Predict Results | Skyhighes | Data Science & Machine Learning in Python](https://1a-1791.com/video/s8/1/I/_/Y/P/I_YPt.oq1b.2-small-8.-Hands-on-Predict-Results.jpg)


![9. [Hands-on] Visualize Results | Skyhighes | Data Science & Machine Learning in Python](https://1a-1791.com/video/s8/1/9/_/Y/P/9_YPt.oq1b.2-small-9.-Hands-on-Visualize-Resul.jpg)