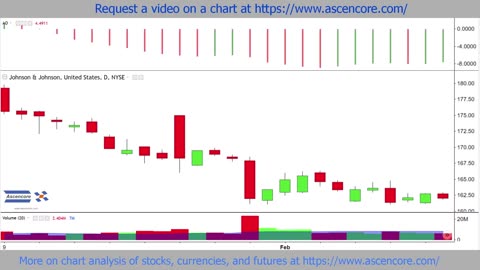
11 months agoStock Chart Technical Analysis (Bearish Engulfing) Candlestick Chart Pattern AnalysisAscencore
2 days agoContinuation Chart Patterns to Make Money in Share Market, Crypto & Forex Trading | Free CourseAr0ra
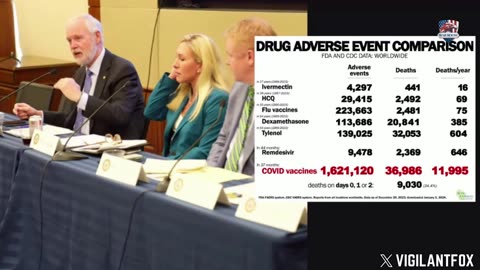
11 months agoSen. Ron Johnson Presents a Must-See Chart About the COVID VaccinesVigilant News NetworkVerified
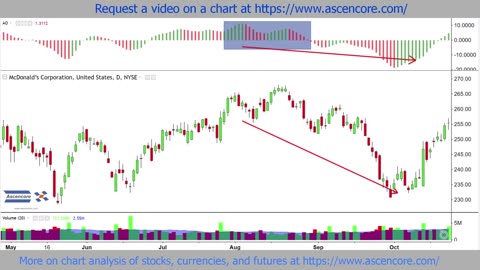
11 months agoMcDonald’s (MCD) Stock Chart Analysis With The Awesome Oscillator Twin Peaks SetupAscencore
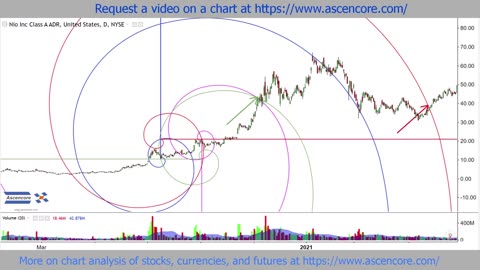
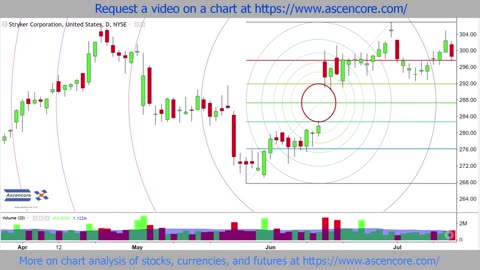
11 months agoNike (NKE) Stock Chart Analysis With Fibonacci Arcs (How To Use Fibonacci Arcs)Ascencore
5 months agoTrump's Stock PUMPS, Breaking Market News & The Week Ahead || The MK ShowMatt KohrsVerified
9 days agoES MES Key Levels. Where Are We At? Chart Analysis. Micros Trading System. Friday "AM Briefing"MicrosTrader: Learn to Scalp ES MES Futures
6 months agoGameFi! $FLOKI $BEAM $ILLUVIUM $ILV 10x? Live Chart Analysis Crypto Price PredictionAlgo Factory
13 days agoES MES Key Levels. Where Are We At? Chart Analysis. Micros Trading System. Monday "AM Briefing"MicrosTrader: Learn to Scalp ES MES Futures
11 months agoIBM Stock Chart Analysis Example Case Study 4 Stable & Unstable Short Term Movement IdentificationAscencore
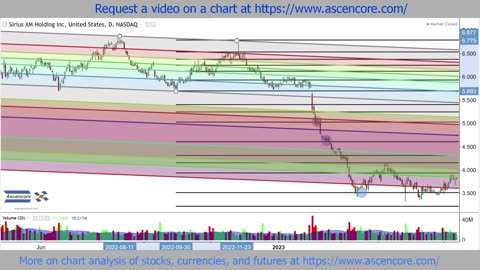
10 months agoFibonacci Channels Combined With Retracements For Time Analysis SIRI Stock Chart ExampleAscencore
11 months agoBearish Continuations On Stock Charts With The Awesome Oscillator Saucer Setup ExampleAscencore
10 days agoES MES Key Levels. Where Are We At? Chart Analysis. Micros Trading System. Thursday "AM Briefing"MicrosTrader: Learn to Scalp ES MES Futures