5 months agoStock Chart Technical Analysis With Candlestick Chart Pattern (Explained Using Real Examples)Ascencore
11 months agoStock Market Plunges: Sensex Crashes by 200 Points! Sensex और NIFTY क्या हैInvestingElixir
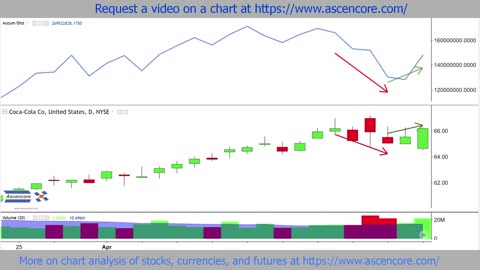
6 months agoExplaining The Accumulation Distribution AD Indicator An Analysis Of Coca-Cola Stock ChartAscencore
9 months ago#shorts - Escrow Impact: Rising Mortgage Costs Explained - The Passive Money Plan - #escrowThePMP
6 months agoReport on the stock market sectors influenced by the decrease in inflation"Stay Informed with libranews: All the News You Need"
5 months agoA Quick Guide To Fibonacci Speed Resistance Arcs Explained With Real Chart ExamplesAscencore
5 months agoFibonacci Speed Resistance Fans Proportions Explained With SNOWflake Stock Chart ExampleAscencore
11 months ago#shorts - Understanding Net Worth: Your Financial Health Explained! The Passive Money Plan - #moneyThePMP
9 months ago#shorts - Financial Crisis vs. Today: Buying Requirements Explained - The Passive Money PlanThePMP
11 months ago#shorts - Gross Income Explained: Understanding Your Total Earnings - The Passive Money PlanThePMP
6 months agoArnaud Legoux Moving Average (ALMA) Indicator Explained With Real Chart ExamplesAscencore