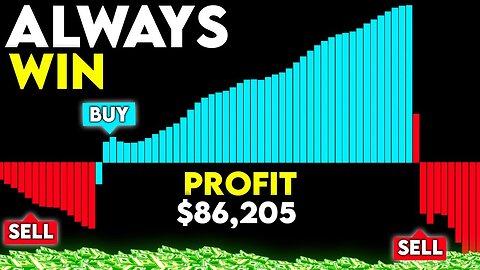
2 months agoThe BEST TradingView Indicator Ever Createdcrypto , stock and forex trading analysing method
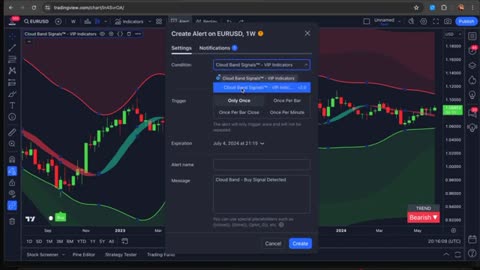
2 months agoSECRET TradingView Indicator Only Top 1% Traders Usecrypto , stock and forex trading analysing method
20 days agoVente à découvert sur les Penny Stocks - Trading en direct #daytrade #actionsDoyle Exchange
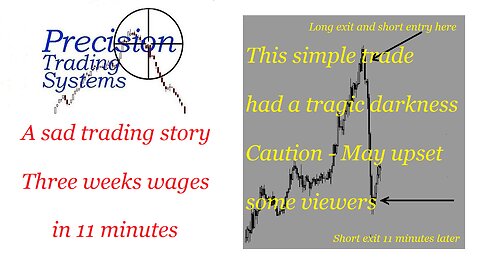
7 months agoThree weeks wages in 11 minutes assisted by the Early Warning indicator- Viewer discretion advised.PrecisionTradingSystems
7 months agoShort intro - part 1 This Early Warning indicator has been a vital part of my trading toolboxPrecisionTradingSystems
20 days agoThe Hidden Crypto Indicator That Reveals True Value Before You Sell!Crypto for the Rest of Us