2 hours agoFootage of Muslim Mayoral Candidate Praising Somalia in Minneapolis Resurfaces | Drew HernandezThe Gateway PunditVerified
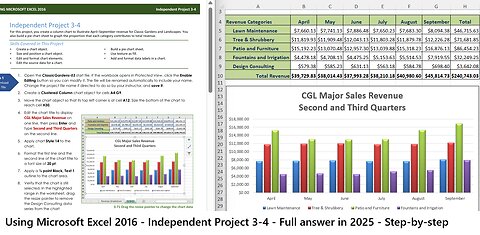
3 months agoUSING MICROSOFT EXCEL 2016 - Independent Project 3-4 - Classic Garden - Full answer in 2025saxi753
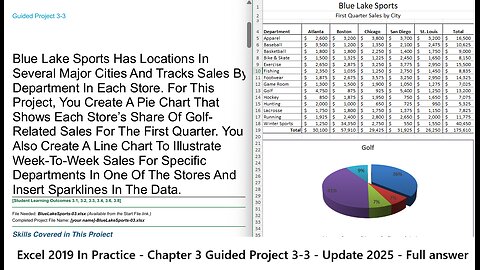
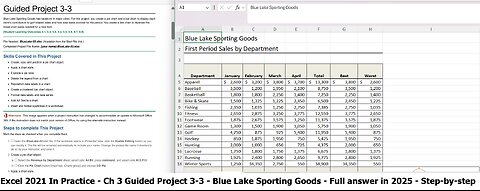
3 months agoExcel 2019 In Practice - Chapter 3 Guided Project 3-3 - Blue Lake Sports - Update 2025saxi753
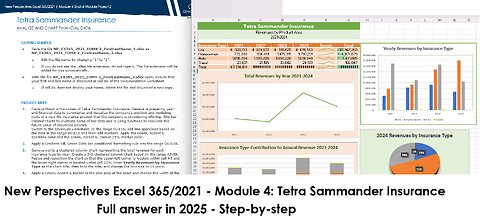
3 months agoNew Perspectives Excel 365/2021 | Module 4: End of Module Project 2 | Tetra Sammander Insurance 2025saxi753
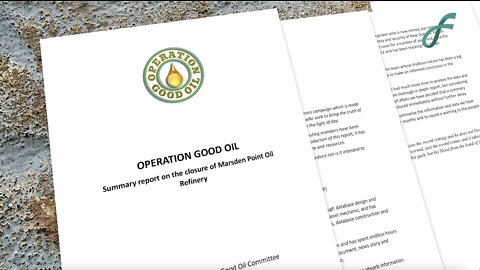
3 years agoDavid Trotter & Levi Wulf of Operation Good Oil - Marsden Point Oil RefineryFreeNZVerified
2 months agoExcel 2021 In Practice - Ch 3 Guided Project 3-3 - Blue Lake Sporting Goods (Update in 2025)saxi753
1 day agoEp.448 South Korea To Pay $350B For Lower Tariffs! Autopen Scandal Reignites! Kash Shuts Down Charlie Kirk Foreign Involvement Investigation, Blocks Access! Artic Frost Scandal Explodes: Smith Intended to Wipe Out GOP!Common [CENSORED]: An America First Show
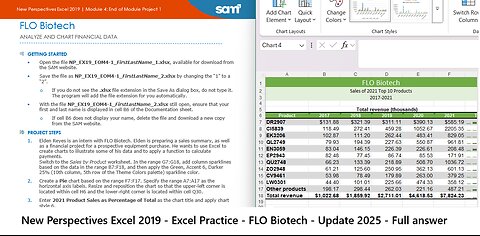
3 months agoNew Perspectives Excel 2019 | Module 4: End of Module Project 1 | FLO Biotech (Update 2025)saxi753
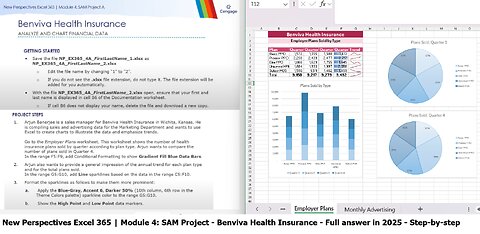
2 months agoNew Perspectives Excel 365 | Module 4: SAM Project A| Benviva Health Insurance (Full answer in 2025)saxi753
3 months agoShelly Cashman PowerPoint 2019 | Module 6: SAM Project 1a | Oakland College - Full answer 2025saxi753
2 years agoThe Cult - Soul Asylum (Live in Houston, Texas 2019) Excellent AudienceClassic Rock Live Music (High Quality Audio)
1 year agoJim Welsh: Debts and Deficts Surge As Fed & Fiscal Policies FailPalisades Gold RadioVerified
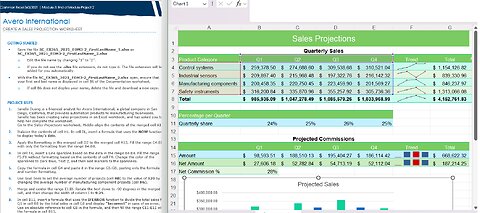
6 months agoShelly Cashman Excel 365/2021 | Module 3: End of Module Project 2 | Avero International Update:2025saxi753
2 years agoThe Cult - Dreamtime (Live in Goteborg, Sweden 1984) Excellent RecordingClassic Rock Live Music (High Quality Audio)
2 years agoThe Cult - Gimmick (Live in Goteborg, Sweden 1984) Excellent RecordingClassic Rock Live Music (High Quality Audio)
2 years agoThe Cult - Go West (Live in Goteborg, Sweden 1984) Excellent RecordingClassic Rock Live Music (High Quality Audio)
2 years agoThe Cult - Bone Bag (Live in Goteborg, Sweden 1984) Excellent RecordingClassic Rock Live Music (High Quality Audio)
3 months agoNew Perspectives Excel 2019 | Module 8: End of Module Project 1 | Four Winds Energysaxi753
2 years agoThe Cult - 83rd Dream (Live in Goteborg, Sweden 1984) Excellent RecordingClassic Rock Live Music (High Quality Audio)
2 years agoThe Cult - Resurrection Joe (Live in Goteborg, Sweden 1984) Excellent RecordingClassic Rock Live Music (High Quality Audio)
2 years agoThe Cult - Bad Medicine Waltz (Live in Goteborg, Sweden 1984) Excellent RecordingClassic Rock Live Music (High Quality Audio)