3 months agoEpisode 675 - Tulsi Gabbard: The Deep State's Propaganda Playbook Is Only Possible Through....DTOOVerified
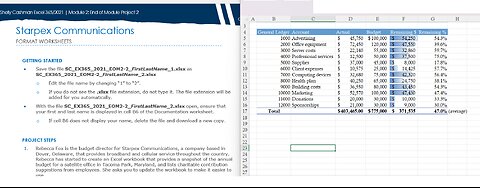
7 months agoShelly Cashman Excel 365/2021 | Module 2: End of Module Project 2 Starpex Communicationssaxi753
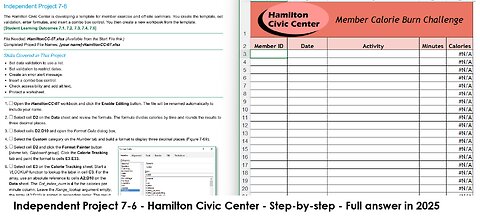
3 months agoIndependent Project 7-6 - Excel Project - The Hamilton Civic Center (Full answer in 2025)saxi753
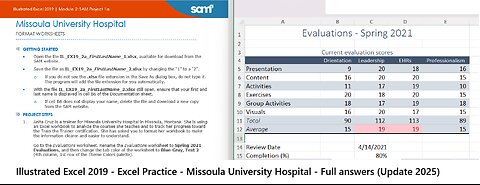
4 months agoIllustrated Excel 2019 | Module 2: SAM Project 1a | Missoula University Hospital (Update 2025)saxi753
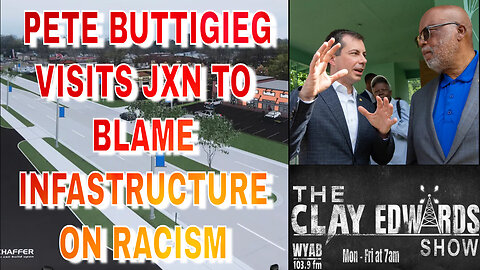
1 year agoPete Buttigieg visits JXN to highlight Medgar Evers Blvd. project and blame potholes on racismClay Edwards ShowVerified
2 years agoHow to Create Result Card in JavaScript | Mark sheet | result card design | result sheet | Mr TechMr Tech 001